


最近遇到一个 业务场景,核心功能点是折线图上有多条markLine,每条markLine都可以随意拖动,拖动其中一条,其余分割线等间距变化,同时折线图有dataZoom,缩放的过程不影响markLine拖动!
一、实现思路
- echarts自带属性graphic属性,支持rect、circle、image等多种type,markLine添加拖动功能可给每个markLine添加一个graphic,zIndex比markLine大,通过设置style,相当于覆盖在每条分割线上方,在拖拽graphic之后的回调函数ondragend中实时改变markLine的xAxis坐标位置
- graphic的position是图表上的坐标,不是像素值,所以在dataZoom缩放过程要实时更新graphic的position
二、实现代码
此处省略echart渲染折线图代码…
  // this.graphicXData为markLine的x轴坐标的数组
  refreshGraphic () {
      const that = this
      const graphic = []
      this.$refs.frequencyChart.setOption({ graphic: [] })
      this.graphicXData.map((item, index) => {
        graphic.push({
          type: 'rect',
          z: 101,
          shape: {
            width: 1,
            height: 180
          },
          position: [that.$refs.frequencyChart.echart.convertToPixel({ xAxisId: '1' }, item), 110],
          draggable: true,
          style: {
            //fill: 'rgba(255, 255, 255, 0)',
            fill: 'red',
            lineWidth: 1
          },
          cursor: 'move',
          ondragend: (param) => {
          // index是为了区分当前拖动的是哪一条markLine
            that.onDragend(index, param)
          }
        })
      })
      this.$refs.frequencyChart.setOption({ graphic: graphic })
    },
    // 拖拽完渲染
    onDragend (index, param) {
      const position = param.target.x
      this.graphicX = this.$refs.frequencyChart && this.$refs.frequencyChart.echart.convertFromPixel({ xAxisId: '1' }, position)
      this.drawLine() //该函数是折线图初始化渲染函数
    },
     // dataZoom缩放更新graphic,不加此代码,dataZoom缩放之后markLine位置改变,graphic仍在原位
      this.$refs.frequencyChart.onChartEvent('dataZoom', (param) => {
        this.refreshGraphic()
      })
如图,用不同颜色区分markLine与graphic,实际代码可将graphic的style的fill改成markLine同色

如图,dataZoom有缩放,红色graphic跟随markLine移动,并覆盖在markLine上方,重合
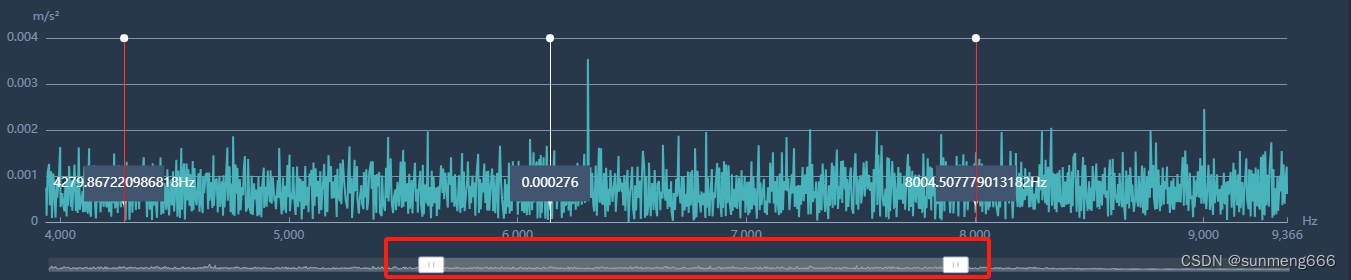
ps:截图中没有红色线覆盖的markLine是中轴线,左右红色graphic对称,业务需要…
总结
- convertToPixel与convertFromPixel是graphic像素与图表位置相互转换的一对API
- dataZoom缩放之后,直接重新渲染graphic的position,不需要计算缩放比例


 5027
5027


 被折叠的 条评论
为什么被折叠?
被折叠的 条评论
为什么被折叠?
 到【灌水乐园】发言


