


4. Web Structure Mining
Definition: Discovery and interpretation of patterns in the hyperlink structure of the Web; the social ties among actors that interact on the Web.
Typical sources of web graphs
(1) web crawls including HTML pages and hyperlinks
A hyperlink graph is a collection of hyperlinks between web pages which belong to web sites.
(2) social networks representing relations between actors
A social network is a set of relations (e.g. friendship, interest, data exchange) between social entities, i.e. members of a social system (actors).
(3) knowledge graphs that have been extracted from the Web
A knowledge graph is a set of relations having different types (e.g. located in, painted, is interested in, is a) between entities (Mona Lisa, Louvre, Da Vinci) belonging to classes (e.g. persons, paintings, museums, places, dates).
(4) other types of community data (discussion forums, email conversations, navigation paths …)
Web structure mining focuses on the structure, but is also often combined with content or usage mining techniques
4.1 Describing Graphs
4.1.1 Terminology and Metrics
4.1.1.1 Graph


4.1.1.2 Adjacency Matrix


4.1.1.3 Bipartite Graphs
Bipartite graph (or bigraph) is a graph whose vertices can be divided into two disjoint sets U and V such that every line connects a vertex in U to one in V; that is, U and V are independent sets.
Examples: movie/actor network, disease/symptom network, photo/tag network on Flickr, customer/product recommendations

4.1.1.4 Vertex, Arc and Edge Attributes
Vertex, Arc and Edge can have Attributes
Vertices are described by attributes in many real-world networks
Combining these attributes with measures such as degree often reveals interesting insights
4.1.1.5 Degree


Maximal out-degrees are much smaller than maximal in-degrees.

4.1.1.6 Graph Density


4.1.1.7 Clustering Coefficient


4.1.1.8 Paths

4.1.1.8.1 Shortest Path/Distance

4.1.1.8.2 Network Diameter and Average Distance


Small-World Phenomenon: High average clustering coefficient & Small average shortest path length

4.2 Prominence
Who are the “most important” actors in a social network?
Centrality
A central actor is one involved in many edges.
The edge direction is not considered.
Prestige
A prestigious actor is one who is the target of many arcs.
The direction of arcs is considered.
Possible interpretations
Centrality: „social power“ of an actor
Prestige: „reputation“ of an actor
4.2.1 Centrality
Which nodes are most ‘central’? - Calculated for undirected graph
Definition of ‘central’ varies by context / purpose:
- Local measure: Degree centrality
- Relative to rest of network:
Closeness centrality: how close one to others
Betweenness centrality: how important connect community through this guy
How evenly is centrality distributed among nodes?
- Centralization
- Graph-level view
4.2.1.1 Degree centrality
Measure centrality as the number of edges to other vertices in the graph.


4.2.1.3 Centralization
衡量网络节点中心性不平衡程度,即节点的中心性是否集中在少数几个节点上


4.2.1.4 Betweenness Centrality
In what contexts may degree be insufficient to describe centrality?
- Ability to broker between groups
- Likelihood that information originating from anywhere in the network reaches you
These use cases require measures that are relative to the rest of the network.
Intuition: How many pairs of individuals would have to go through you in order to reach one another in the minimum number of hops?
Assumptions:
Interactions between two non-adjacent actors might depend on the other actors in the set of actors, especially the actors who lie on the paths between the two nodes.
“Actor in the middle” between the others has some control over paths in the network – “interpersonal influence”.


4.2.1.5 Closeness Centrality
The measure focuses on how close an actor is to all the other actors in the network. For instance to spread information or interact with others or to be reached by information that spreads through the network.
Closeness centrality is based on the length of the average shortest path between a vertex and all vertices in the graph.


4.2.1.6 Correlation of Centrality Metrics
Generally different centrality metrics will be positively correlated.
When they are not, there is likely something interesting about the vertex.
4.2.2 Prestige
Prestige refers to a class of prominence metrics which take the direction of arcs into account. Translates to: choices received
Examples where direction matters: votes in an election, hyperlinks on the WWW, likes on TikTok, citations of scientific papers
Examples when ‘prestige’ may not be the right word: dislikes, distrusts
4.2.2.1 Degree Prestige / Popularity
The simplest vertex-level measure of prestige: in-degree
The idea is that actors who are prestigious tend to receive many nominations or choices
Local measure as only the neighbors are taken into account.

4.2.2.2 Input Domain
Degree prestige only counts actors who are directly adjacent to actor ni, but we might also want to take indirect choices into account. The input domain of a vertex in a directed network is the number or percentage of all other vertices that are connected by a path to this vertex. Also called influence domain.
4.2.2.3 Proximity Prestige
Prestige measure based on distances in the input domain.
- Direct nominations (choices) should count more than indirect ones
- Nominations from second degree neighbors should count more than third degree ones


4.2.2.4 Rank Prestige and Page Rank

4.3 Community Detection
A community is a set of actors between which interactions are (relatively) frequent. Communities are also called groups, cohesive subgroups, clusters, or modules in different contexts. Finding a community in a social network is to identify a set of nodes such that they interact with each other more frequently than with those nodes outside the group
Why analyze communities?
Analyzing communities helps to better understand users
-> patters might be clearer on group level
Groups provide a clear global view of user interactions
-> network compression
-> visualization of huge networks
Comparing individual behavior and behavior expected by the group might lead to interesting insights
-> some republican can agree with some democrats, but their parties disagree
The perception of community is task dependent.
4.3.1 Connected Components and K-Cores
Connected graph: Any two vertices of an undirected graph are joined by a path. A disconnected graph is made up by two or more connected components.
Bridge: if we remove it, the graph becomes disconnected (red line).
Cut vertex: if we remove it, the graph becomes disconnected (F and A).

If the largest component encompasses a significant fraction of the graph, it is called the giant component.
The other smaller components are called isolates.
Connectivity of Directed Graphs
Strongly connected directed graph: has a path from each vertex to every other vertex and vice versa (e.g. AB path and BA path).
Weakly connected directed graph: is connected if we disregard the arc directions.

4.3.1.1 Connected Components of Directed Graphs


4.3.1.2 K-Cores


4.3.1.3 Cliques
A clique is the maximal complete subgraph containing three vertices or more.
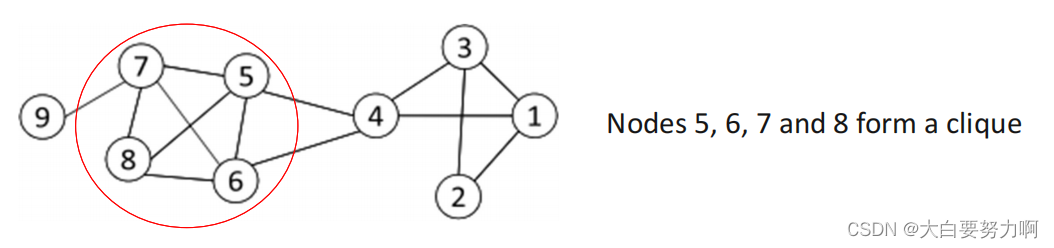
Cliques are the strongest form of community as all vertices need to be directly adjacent to each other.
Problems:
The definition is often too restrictive to detect communities in real-world networks (result: large number of very small cliques)
Finding cliques in larger graphs is computationally expensive
4.3.1.4 Overlapping Complete Subgraphs
Alternative less restrictive approach: Consider overlapping complete subgraphs (triads) as cohesive group.
Triads overlap if they share one or more vertices.

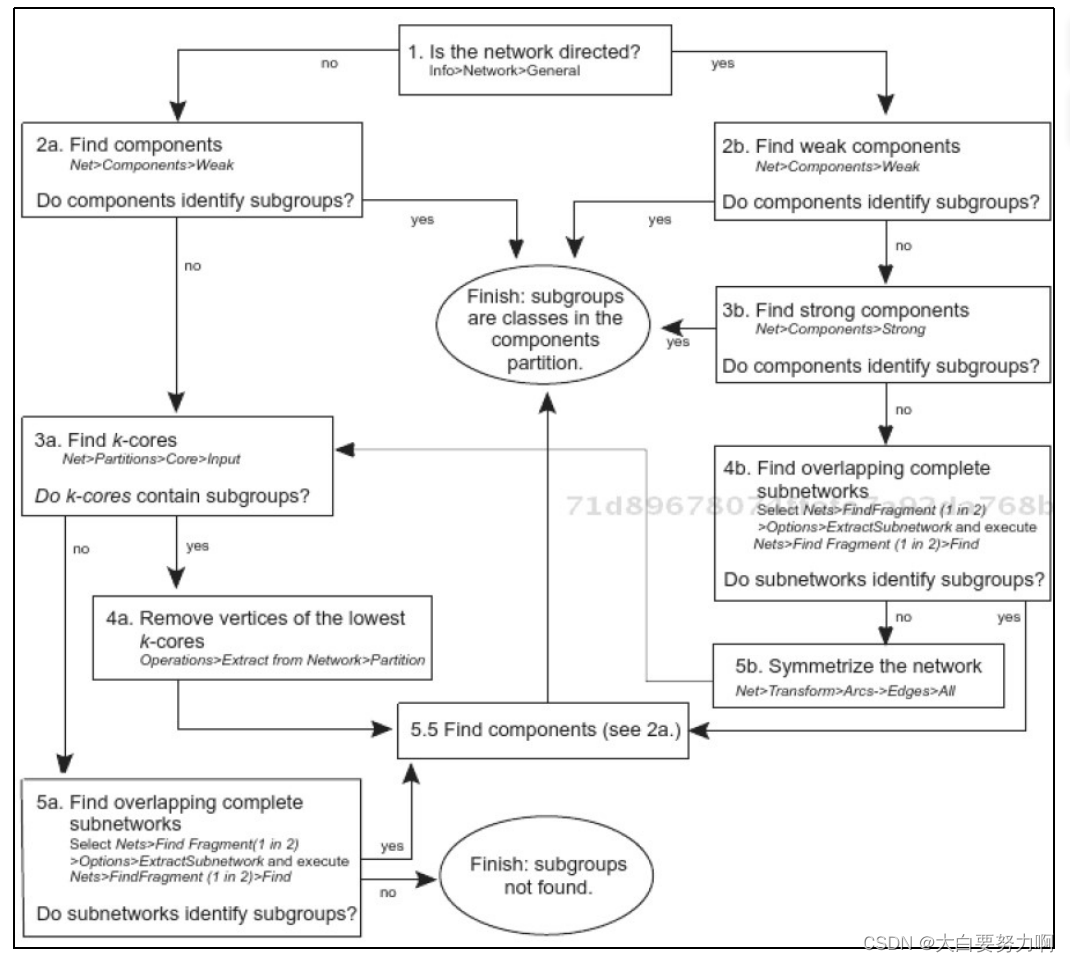
Procedure for the Analysis of Cohesive Subgroup
Idea: Successively increase the minimal density required.
After each step: Check if discovered groups make sense based on your knowledge about the application domain.
4.3.2 Clustering-based Techniques
4.3.2.1 Hierarchical Communities
Previous methods consider communities at a single level
- Communities may form hierarchies (Each community can have sub/super communities)
- Hierarchical clustering deals with this scenario and generates community hierarchies
Initially n members are considered as either 1 or n
communities in hierarchical clustering.
These communities are gradually merged (agglomerative hierarchical clustering) or split (divisive hierarchical clustering)
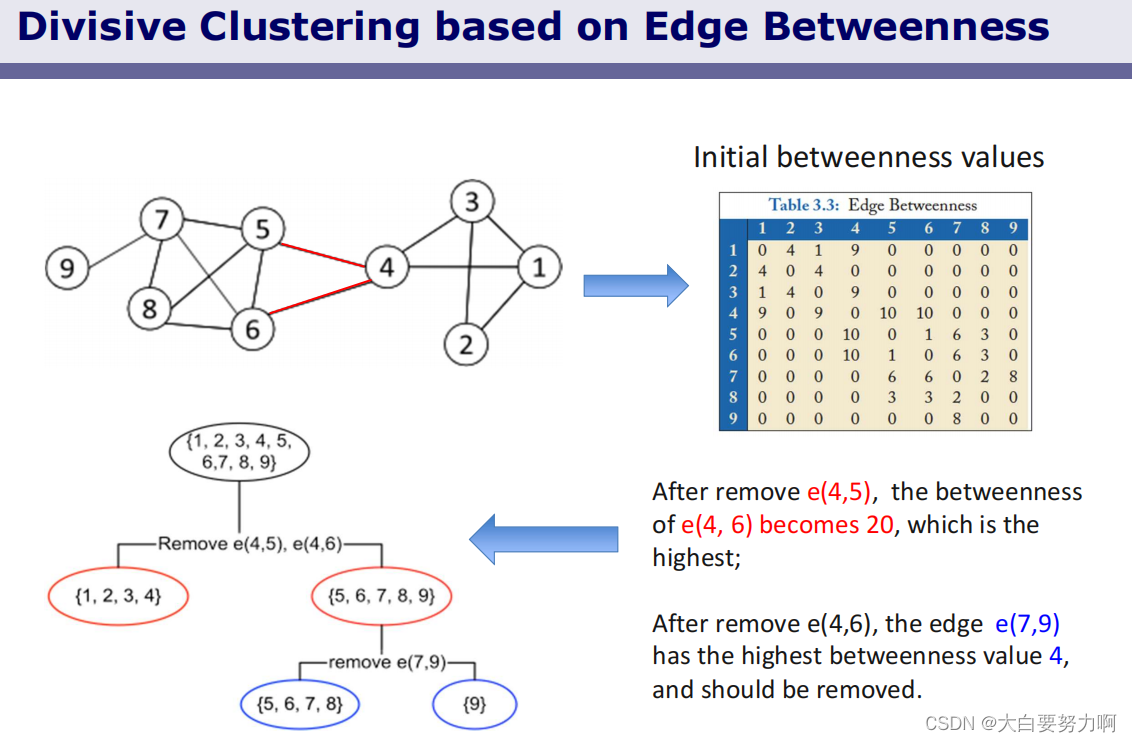
Divisive Hierarchical Clustering
Goal: Build a hierarchical structure of communities based on the network topology.
Allows the analysis of a network at different resolutions
Approach: Recursively remove the “weakest” edge
- Find the edge with the least strength
- Remove (cut) the edge and update the corresponding strength of each edge
- Recursively apply the above two steps until a network is decomposed into desired number of components.
- Consider each component to form a community.
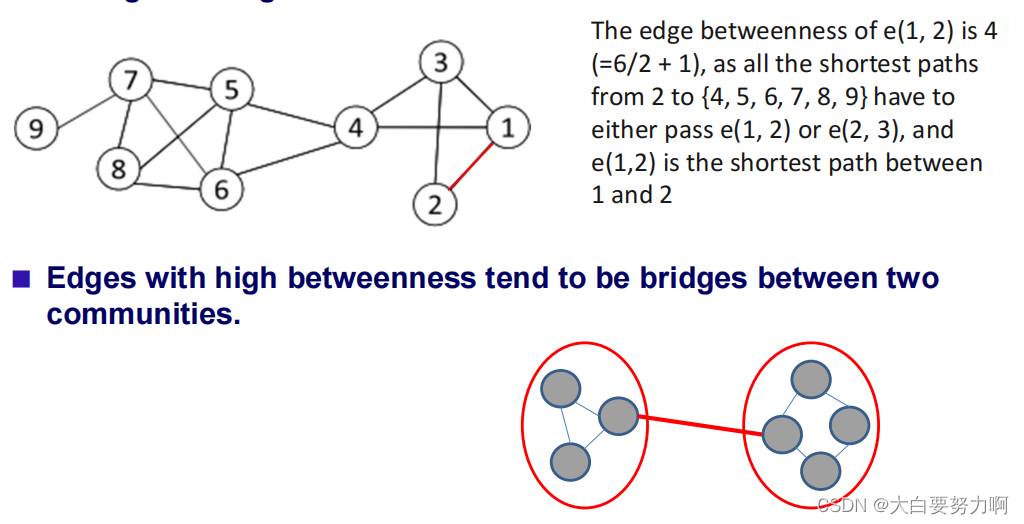
The strength of an edge can be measured by edge betweenness(number of shortest paths that pass through the edge).
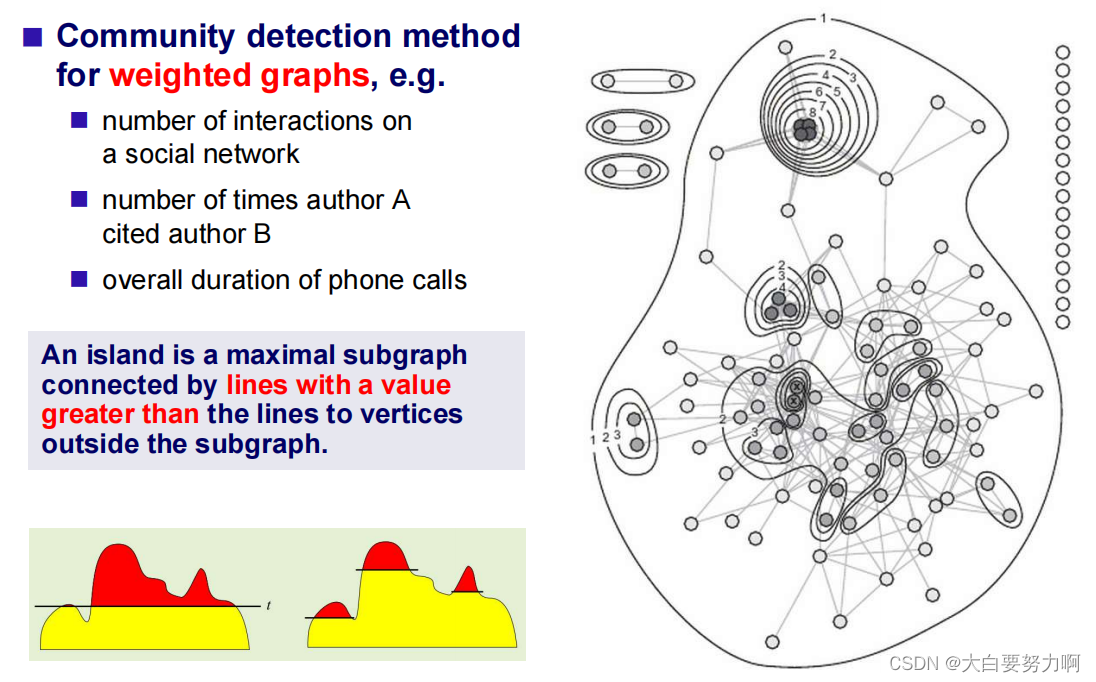
4.3.2.2 Islands
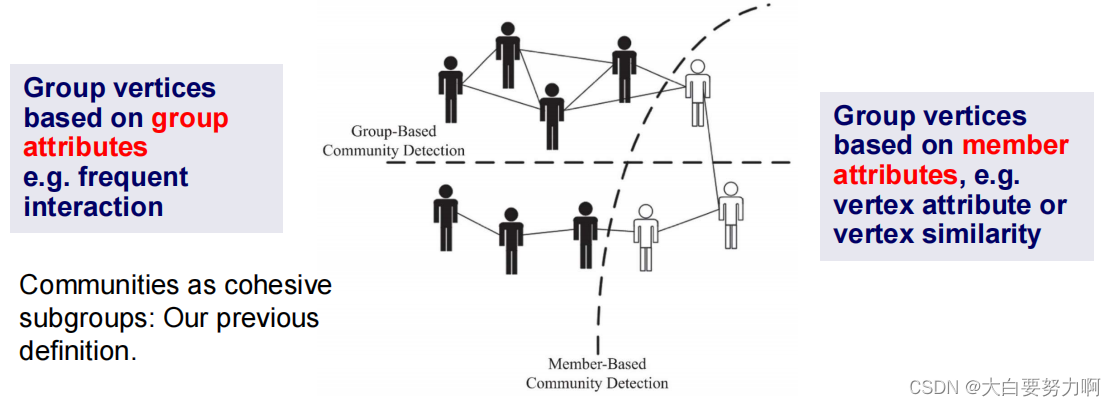
4.3.2.3 Communities based on Vertex Attributes
Sometimes it makes sense to form communities based on member attributes and not based on frequent interaction.
Summary: Community Detection
The different approaches use different features for clustering vertexes:
- Components: Vertex connectivity
- K-Cores: Vertex degree
- Cliques: Maximal density
- Overlapping complete subgraphs: high density and bridges
- Divisive hierarchical clustering: Betweenness on shortest paths
- Islands: Edge weights
- Vertex Attributes
Which feature/approach fits depends on the concrete use case
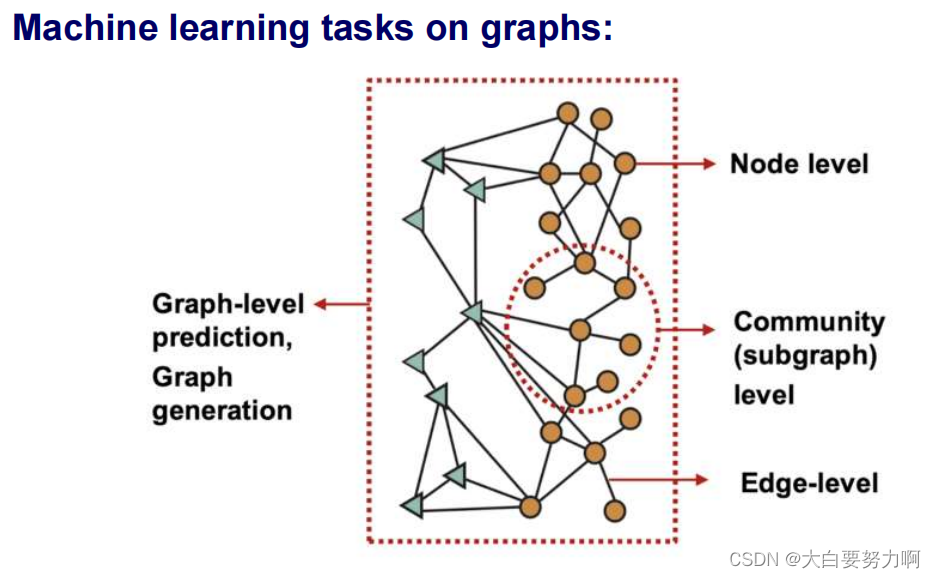
4.4 Machine Learning with Graphs
Goal: Learn a model from a graph for predicting missing edges or graph or node properties.
4.4.1 Link Prediction and Node Classification
4.4.1.1 Link Prediction
The task is to predict new links based on existing links
Applications:
friend suggestions on Facebook
knowledge graph completion
product recommendation
4.4.1.2 Node Prediction
The task is to predict a vertex attribute value based on its neighborhood
Applications:
type prediction in knowledge graphs
molecule property prediction: cancer beating?
bot detection in social networks
topic detection in citation graphs
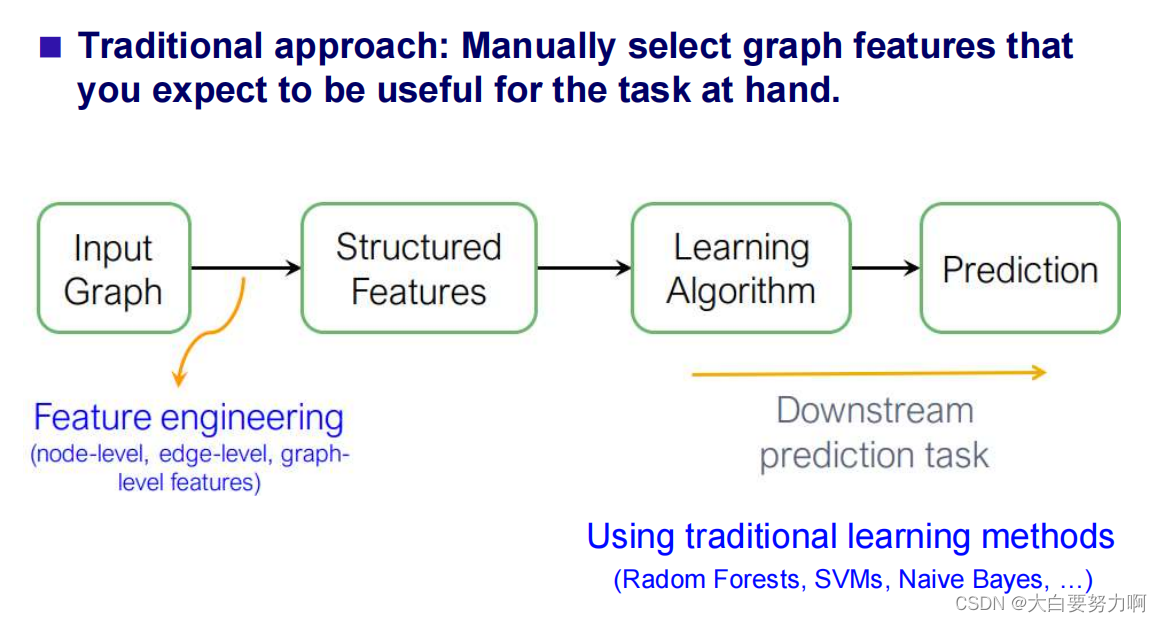
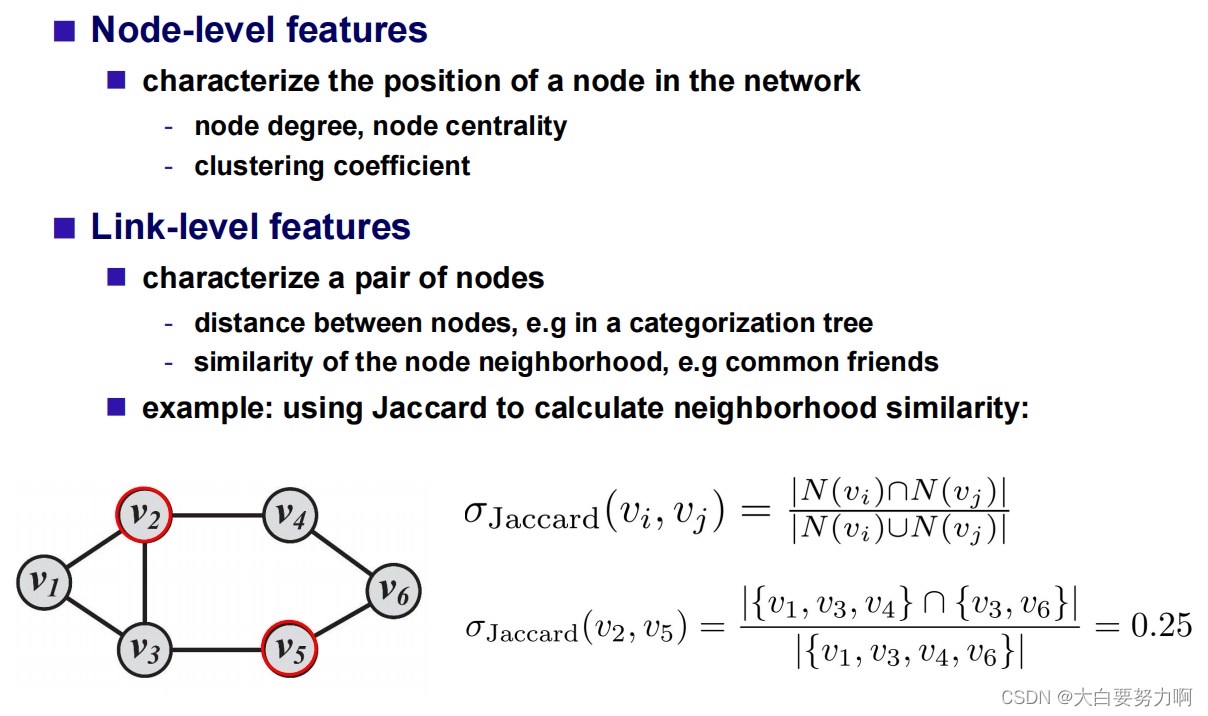
4.4.1.3 Feature Engineering
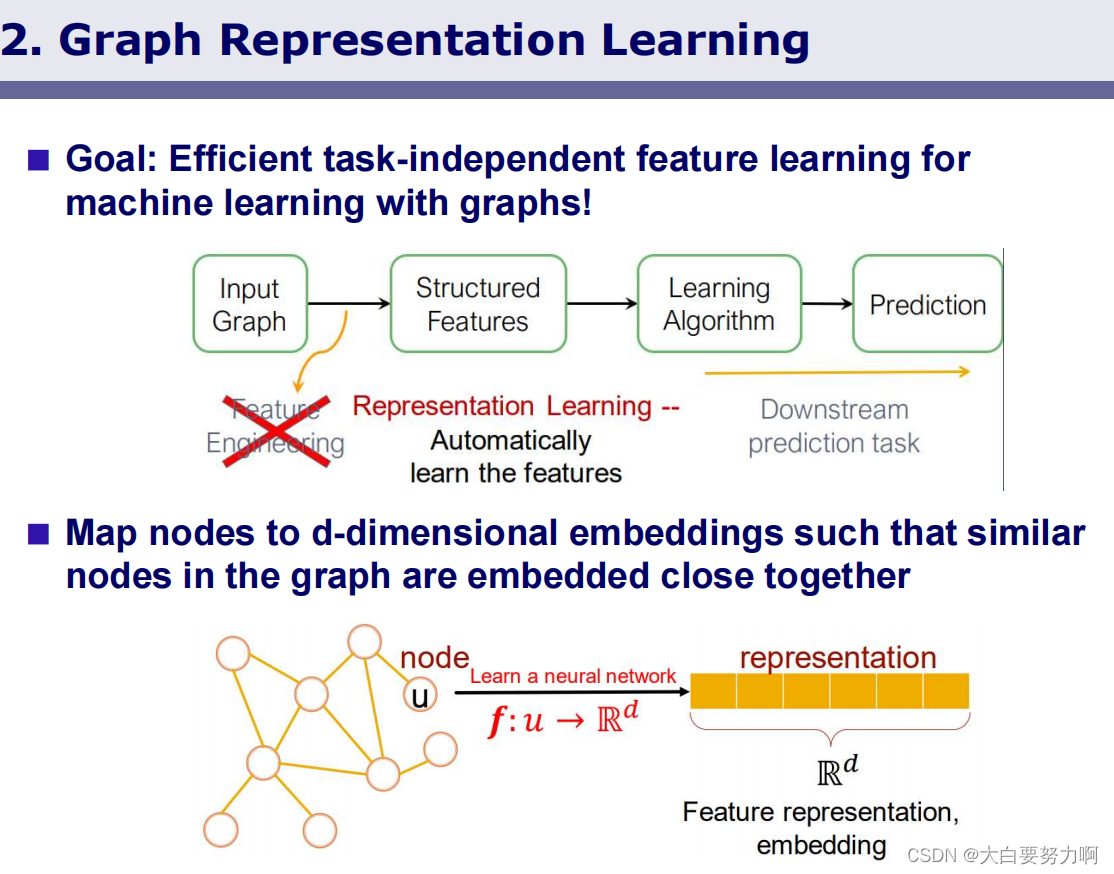
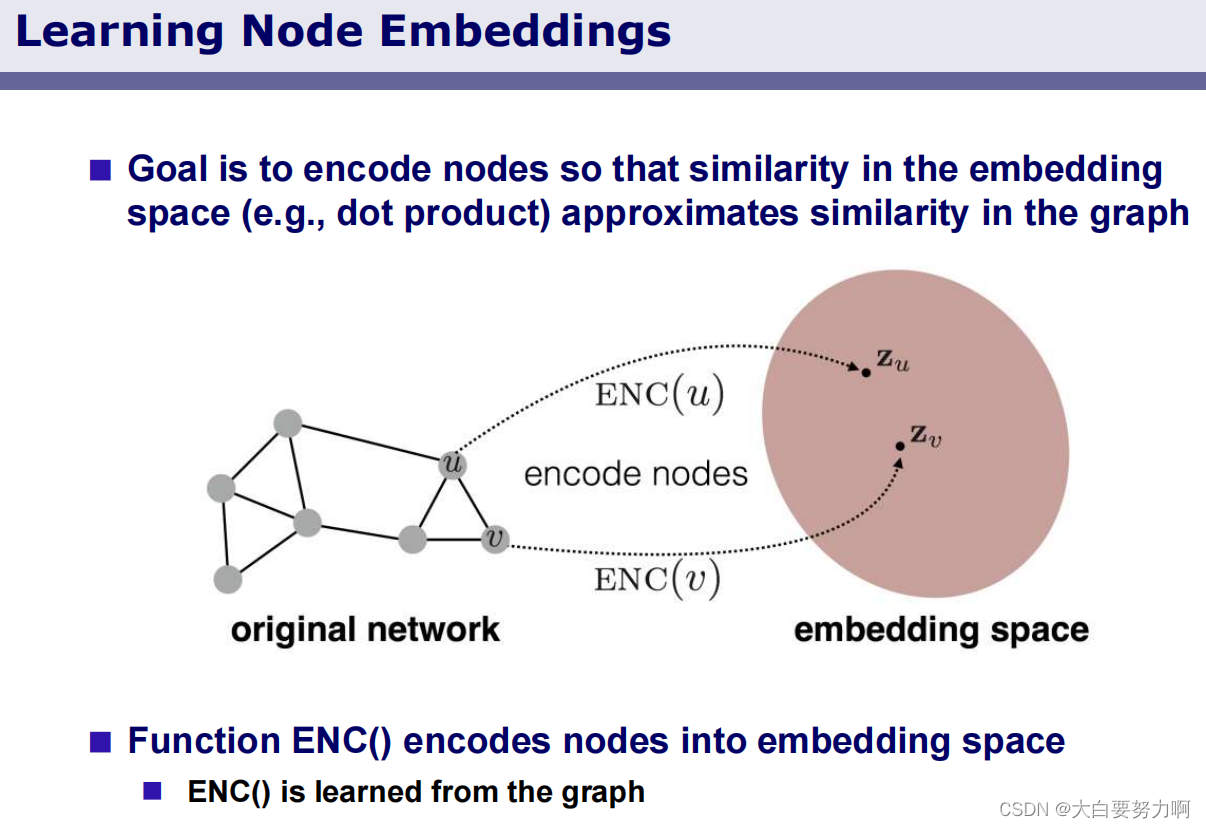
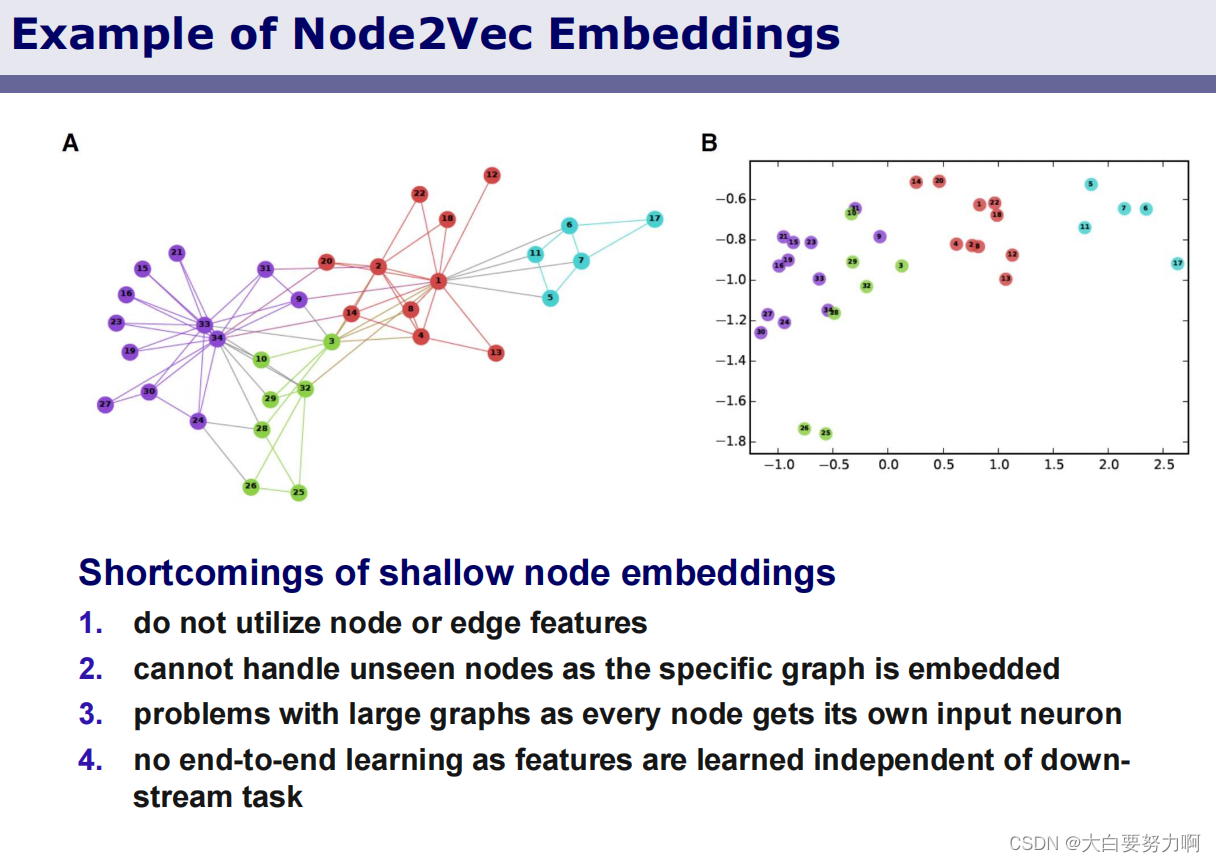
4.4.2 Node Embeddings

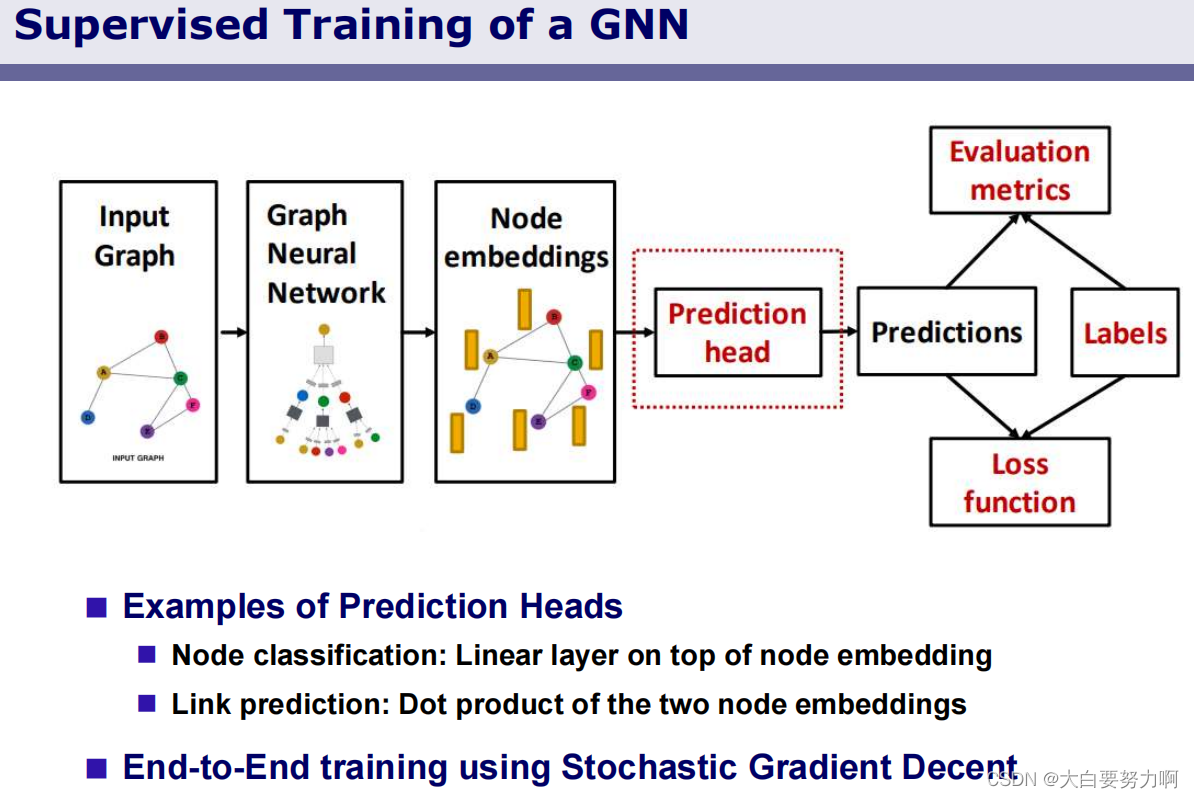
4.4.3 Graph Neural Networks
Intuition: Nodes aggregate information from their neighbors using neural networks

Variants of Graph Neural Networks
- Graph Convolutional Networks (GCN)
use simple permutation invariant aggregation functions, e.g. sum(), mean() or max()
sum result with embedding of node itself - GraphSAGE
subsamples neighbors to speed up computation
offers more expressive aggregations, e.g. LSTM - Graph Attention Networks (GAT)
aggregation uses multi-headed attention to focus on messages from relevant neighbors
current state-of-the-art architecture
Implementation: PyG (PyTorch Geometric) - Python library that implements various GNNs
Graph Data Repositories and Benchmarks
- Stanford Large Network Dataset Collection
social networks, e-commerce networks, citation networks
https://snap.stanford.edu/data/ - Common Crawl
regularly publishes host- and domain-level web graphs
host graph May 2021: 515M nodes and 2.82B edges
https://commoncrawl.org/connect/blog/ - Scientific Network Data Repository
networks from 30+ categories / disciplines
https://networkrepository.com/ - Benchmarks
Node Classification: https://paperswithcode.com/task/node-classification
Link Prediction: https://paperswithcode.com/task/link-prediction


 884
884


 被折叠的 条评论
为什么被折叠?
被折叠的 条评论
为什么被折叠?
 到【灌水乐园】发言


