


使用QCustomPlot读取文件并显示
说明
一个小练习,在Windows和Ubuntu上做一个绘图的功能,可以进行FFT并显示。
一、QCustomPlot
QCustomPlot还是很好用的,个人感觉跟Qwt差不多,速度能快一点,也可能是研究的不是很深。但是考虑到要在Ubuntu上用而且绘图功能很简单所以就直接用QCustomPlot,而且QCustomPlot可以直接加到工程,不用编库,小工程比较方便。
二、FFTW3快速傅里叶变换
工程用了FFTW3库进行快速傅里叶变换,要注意Windows和Ubuntu要编不同的库,其实主要是在编库的时候遇到了一些麻烦。这里主要是还是对Ubuntu的一些操作不是很熟悉的原因。
三、界面
读取了一个二进制文件,文件时两个通道的正弦函数相加,可以选择文件大小,显示范围。以及一些常见的滚轮放放大,框选放大,游标显示等一些常规操作。设置了三个通道但是工程只写了两个通道的读写。

图1–时域显示如上
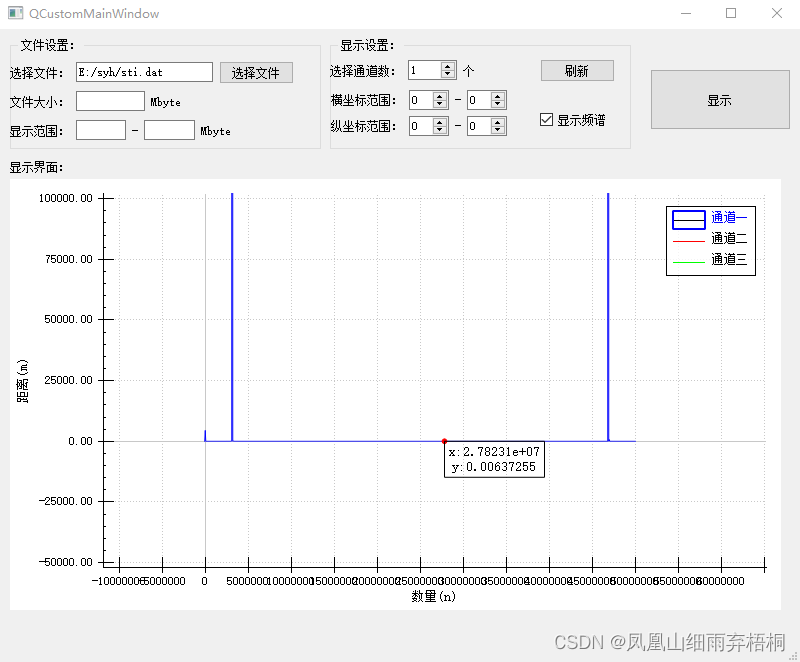
图2–频域显示如上
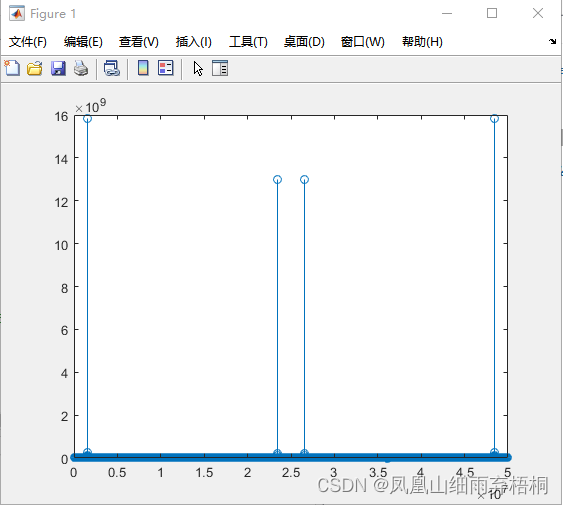
图3–matlab进行的快速傅里叶变换如上
四、代码
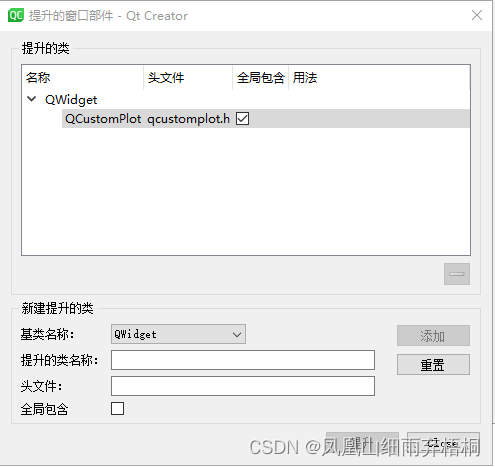
1 .ui文件
在ui文件中将QWidget提升为QCustomPlot,主要就进行了这一步,其中剩下的就时一些常规的ui文件编辑。
2 .h文件
这里没有进行数据处理只是进行了一些绘图和ui界面的一些操作,考虑之后的功能可能有大量的连续数据进行处理,单独写了一个线程进行数据处理。
#ifndef QCUSTOMMAINWINDOW_H
#define QCUSTOMMAINWINDOW_H

#include <QMainWindow>
#include <qcustomplot.h>
#include <QCustomThread.h>

QT_BEGIN_NAMESPACE
namespace Ui { class QCustomMainWindow; }
QT_END_NAMESPACE

class QCustomMainWindow : public QMainWindow
{
    Q_OBJECT

public:
    QCustomMainWindow(QWidget *parent = nullptr);
    ~QCustomMainWindow();

private:
    Ui::QCustomMainWindow *ui;
    QCustomThread*          m_QCustomThread;
    QString                 m_strCurshowfile;
    QCPItemTracer*          m_tracer;
    QCPItemText*            m_tracerLabel;
    QCPGraph *              m_tracerGraph;
    QRubberBand *           m_rubberBand;
    QPoint                  m_rubberOrigin;
    bool                    m_chooseFlag;
private:
    void                   GetFileInfo();
    void                   SetQcustomPlot();
private slots:
    void                   ButtonShow();
    void                   FileShow();
    void                   ShowQcustomPlot(QVector<double> data1,QVector<double>data2,QVector<double>datax);
    void                   mousePress(QMouseEvent* mevent);
    void                   mouseMove(QMouseEvent *mevent);
    void                   mouseRelease(QMouseEvent *mevent);
    void                   mouthWheel(QWheelEvent *event);
    void                   slot_SelectionChanged();
};
#endif // QCUSTOMMAINWINDOW_H
.cpp 文件
#include "QCustomMainWindow.h"
#include "ui_QCustomMainWindow.h"
//bool bStartFlag;
#if defined(_MSC_VER) && (_MSC_VER >= 1600)
# pragma execution_character_set("utf-8")
#endif

QCustomMainWindow::QCustomMainWindow(QWidget *parent)
    : QMainWindow(parent)
    , ui(new Ui::QCustomMainWindow)
{
    ui->setupUi(this);
    m_chooseFlag = false;
    connect(ui->pushButton_Show,SIGNAL(clicked()),SLOT(ButtonShow()));
    connect(ui->pushButton,SIGNAL(clicked()),SLOT(FileShow()));

    m_QCustomThread = new QCustomThread();
    connect(m_QCustomThread,SIGNAL(SendDataToPlot(QVector<double>,QVector<double>,QVector<double>)),SLOT(ShowQcustomPlot(QVector<double>,QVector<double>,QVector<double>)));
    SetQcustomPlot();
}

QCustomMainWindow::~QCustomMainWindow()
{
    delete ui;
}

void QCustomMainWindow::GetFileInfo()
{

    //1--显示文件大小
    if(ui->lineEdit_FileSize->text().isEmpty())
    {
        m_QCustomThread->m_FileSize=-1;
    }
    else
    {
        m_QCustomThread->m_FileSize =ui->lineEdit_FileSize->text().toDouble();
    }
    //2--显示范围
    if(ui->lineEdit_FileStart->text().isEmpty())
    {
        m_QCustomThread->m_FileSizeStart=-1;
    }
    else
    {
        m_QCustomThread->m_FileSizeStart=ui->lineEdit_FileStart->text().toDouble();
    }
    if(ui->lineEdit_FileEnd->text().isEmpty())
    {
        m_QCustomThread->m_FileSizeEnd=-1;
    }
    else
    {
        m_QCustomThread->m_FileSizeEnd=ui->lineEdit_FileEnd->text().toInt();
    }
    //3--选择通道数
    m_QCustomThread->m_Channels = ui->spinBox_channels->text().toInt();
    //4--显示时频
    if(ui->checkBox->isChecked())
    {
        m_QCustomThread->m_bFFT = true;
    }
    else
    {
        m_QCustomThread->m_bFFT = false;
    }
}

void QCustomMainWindow::ShowQcustomPlot(QVector<double> data1,QVector<double>data2,QVector<double>datax)
{
    qDebug()<<"ShowQcustomPlot"<<data1.size()<<data2.size()<<datax.size();
    QVector<double>dataxin;
    ui->QcustomWidget->xAxis->setRange(0,500000,Qt::AlignLeft);
    ui->QcustomWidget->yAxis->setRange(0,1000);
    if(data1.size()>0)
        ui->QcustomWidget->graph(0)->setData(datax, data1);
    if(data2.size()>0)
        ui->QcustomWidget->graph(1)->setData(datax, data2);
    ui->QcustomWidget->replot();
}

void QCustomMainWindow::SetQcustomPlot()
{
    for(int i=0;i<3;i++)
        {
            ui->QcustomWidget->addGraph();   //添加数据曲线
        }
        ui->QcustomWidget->graph(0)->setPen(QPen(Qt::black));   //设置曲线颜色
        ui->QcustomWidget->graph(0)->setName("通道一");          //设置曲线名称
        ui->QcustomWidget->graph(1)->setPen(QPen(Qt::red));
        ui->QcustomWidget->graph(1)->setName("通道二");
        ui->QcustomWidget->graph(2)->setPen(QPen(Qt::green));
        ui->QcustomWidget->graph(2)->setName("通道三");
        //x轴设置
        QSharedPointer<QCPAxisTickerFixed> intTicker_M(new QCPAxisTickerFixed);
        intTicker_M->setTickStep(1);                                      //设置刻度之间的步长为1
        intTicker_M->setScaleStrategy(QCPAxisTickerFixed::ssMultiples);   //设置缩放策略
        ui->QcustomWidget->xAxis->setTicker(intTicker_M);                    //应用自定义整形ticker,防止使用放大功能时出现相同的x刻度值
        ui->QcustomWidget->xAxis->ticker()->setTickCount(11);                //刻度数量
        ui->QcustomWidget->xAxis->setNumberFormat("f");                      //x轴刻度值格式
        ui->QcustomWidget->xAxis->setNumberPrecision(0);                     //刻度值精度
        ui->QcustomWidget->xAxis->setLabel("数量(n)");                        //设置标签
        ui->QcustomWidget->xAxis->setLabelFont(QFont(font().family(),10));    //设置标签字体大小
        ui->QcustomWidget->xAxis->setRange(0,10,Qt::AlignLeft);              //范围
        ui->QcustomWidget->xAxis->setSubTickLength(0,0);                     //子刻度长度
        ui->QcustomWidget->xAxis->setTickLength(10,5);                       //主刻度长度
        //y轴设置
        ui->QcustomWidget->yAxis->setNumberFormat("f");
        ui->QcustomWidget->yAxis->setNumberPrecision(2);
        ui->QcustomWidget->yAxis->setLabel("距离(m)");
        ui->QcustomWidget->yAxis->setLabelFont(QFont(font().family(),10));
        ui->QcustomWidget->yAxis->setRange(0,5);
        ui->QcustomWidget->yAxis->setTickLength(10,5);
        ui->QcustomWidget->setInteractions(QCP::iRangeDrag | QCP::iRangeZoom | QCP::iSelectAxes |
                QCP::iSelectLegend | QCP::iSelectPlottables);
        ui->QcustomWidget->legend->setVisible(true);                  //设置图例可见
        ui->QcustomWidget->legend->setBrush(QColor(255,255,255,200));   //设置背景不透明
        ui->QcustomWidget->axisRect()->insetLayout()->setInsetAlignment(0,Qt::AlignTop|Qt::AlignRight);   //设置图例居右上
        //游标
        m_tracer = new QCPItemTracer(ui->QcustomWidget);       //生成游标
        if(m_tracer==nullptr)
            qDebug()<<"m_tracerm_tracerm_tracer"<<m_tracer;
        ui->QcustomWidget->setMouseTracking(true);           //让游标自动随鼠标移动,若不想游标随鼠标动,则禁止
        //tracer->setPen(QPen(QBrush(QColor(Qt::red)),Qt::DashLine));   //虚线游标
        m_tracer->setPen(QPen(Qt::red));                    //圆圈轮廓颜色
        m_tracer->setBrush(QBrush(Qt::red));                //圆圈圈内颜色
        m_tracer->setStyle(QCPItemTracer::tsCircle);        //圆圈
        m_tracer->setSize(5);
        //m_tracer->setVisible(false);                      //设置可见性
        //游标说明
        m_tracerLabel = new QCPItemText(ui->QcustomWidget);                     //生成游标说明
        //m_tracerLabel->setVisible(false);                                  //设置可见性
        m_tracerLabel->setLayer("overlay");                                  //设置图层为overlay,因为需要频繁刷新
        m_tracerLabel->setPen(QPen(Qt::black));                              //设置游标说明颜色
        m_tracerLabel->setPositionAlignment(Qt::AlignLeft | Qt::AlignTop);   //左上
        m_tracerLabel->setFont(QFont(font().family(),10));                   //字体大小
        m_tracerLabel->setPadding(QMargins(4,4,4,4));                        //文字距离边框几个像素
        m_tracerLabel->position->setParentAnchor(m_tracer->position);          //设置标签自动随着游标移动
        //选择不同的曲线
        connect(ui->QcustomWidget,SIGNAL(selectionChangedByUser()),this,SLOT(slot_SelectionChanged()));
        //初始化QRubberBand   //矩形放大
        m_rubberBand = new QRubberBand(QRubberBand::Rectangle,ui->QcustomWidget);
        //连接鼠标事件发出的信号,实现绑定
        connect(ui->QcustomWidget,SIGNAL(mousePress(QMouseEvent*)),this,SLOT(mousePress(QMouseEvent*)));
        connect(ui->QcustomWidget,SIGNAL(mouseMove(QMouseEvent*)),this,SLOT(mouseMove(QMouseEvent*)));
        connect(ui->QcustomWidget,SIGNAL(mouseRelease(QMouseEvent*)),this,SLOT(mouseRelease(QMouseEvent*)));
        connect(ui->QcustomWidget,SIGNAL(mouseWheel(QWheelEvent*)),this,SLOT(mouthWheel(QWheelEvent*)));

        connect(ui->QcustomWidget,&QCustomPlot::mouseMove,[=](QMouseEvent* event)
        {
            if(m_tracer->graph() == nullptr)
            {
                return;
            }
            if(m_tracer->graph()->data()->isEmpty())
            {
                return;
            }
            if(m_tracer->visible())
            {
                if(m_tracerGraph&&m_chooseFlag)
                {
                    double x = ui->QcustomWidget->xAxis->pixelToCoord(event->pos().x());
                    m_tracer->setGraphKey(x);             //将游标横坐标设置成刚获得的横坐标数据x
                    //m_tracer->setInterpolating(true);   //自动计算y值,若只想看已有点,不需要这个
                    m_tracer->updatePosition();           //使得刚设置游标的横纵坐标位置生效
                    m_tracerLabel->setText(QString("x:%1\ny:%2").arg(m_tracer->position->key()).arg(m_tracer->position->value()));
                    ui->QcustomWidget->replot(QCustomPlot::rpQueuedReplot);
                }
            }
        });
}

void QCustomMainWindow::ButtonShow()
{
    //是否开始
    GetFileInfo();
    m_QCustomThread->bStartFlag = true;
    m_QCustomThread->start();
}

void QCustomMainWindow::FileShow()
{
    m_strCurshowfile = QFileDialog::getOpenFileName(this,
               QString::fromLocal8Bit("choose file"),"",QString::fromLocal8Bit("binary file(*.*)"));
    if(m_strCurshowfile.isNull())
    {
        return;
    }
    else
    {
        ui->lineEditFile->setText(m_strCurshowfile);
    }
    m_QCustomThread->m_strFileName = m_strCurshowfile;
}
//鼠标按下槽函数
void QCustomMainWindow::mousePress(QMouseEvent* mevent)
{
    {
        if(mevent->button() == Qt::RightButton)   //鼠标右键实现放大功能
        {
            m_rubberOrigin = mevent->pos();
            m_rubberBand->setGeometry(QRect(m_rubberOrigin, QSize()));
            m_rubberBand->show();
        }
    }
}

//鼠标移动槽函数
void QCustomMainWindow::mouseMove(QMouseEvent *mevent)
{
        if(m_rubberBand->isVisible())
        {
            m_rubberBand->setGeometry(QRect(m_rubberOrigin, mevent->pos()).normalized());
    }
}

//鼠标释放槽函数
void QCustomMainWindow::mouseRelease(QMouseEvent *mevent)
{
//    if(chooseFlag)
    {
        Q_UNUSED(mevent);
        if(m_rubberBand->isVisible())
        {
            const QRect zoomRect = m_rubberBand->geometry();
            int xp1, yp1, xp2, yp2;
            zoomRect.getCoords(&xp1, &yp1, &xp2, &yp2);
            double x1 = ui->QcustomWidget->xAxis->pixelToCoord(xp1);
            double x2 = ui->QcustomWidget->xAxis->pixelToCoord(xp2);
            double y1 = ui->QcustomWidget->yAxis->pixelToCoord(yp1);
            double y2 = ui->QcustomWidget->yAxis->pixelToCoord(yp2);

            ui->QcustomWidget->xAxis->setRange(x1, x2);
            ui->QcustomWidget->yAxis->setRange(y1, y2);

            m_rubberBand->hide();
            ui->QcustomWidget->replot(QCustomPlot::rpQueuedReplot);
        }
    }
}

void QCustomMainWindow::mouthWheel(QWheelEvent *event)
{
    if (ui->QcustomWidget->xAxis->selectedParts().testFlag(QCPAxis::spAxis))
        ui->QcustomWidget->axisRect()->setRangeZoom(ui->QcustomWidget->xAxis->orientation());
    else if (ui->QcustomWidget->yAxis->selectedParts().testFlag(QCPAxis::spAxis))
        ui->QcustomWidget->axisRect()->setRangeZoom(ui->QcustomWidget->yAxis->orientation());
    else
        ui->QcustomWidget->axisRect()->setRangeZoom(Qt::Horizontal | Qt::Vertical);
}

void QCustomMainWindow::slot_SelectionChanged()
{
    for(int i=0;i<3;i++)
    {
        QCPGraph *graph = ui->QcustomWidget->graph(i);
        if(graph == nullptr)
        {
            qDebug()<<"graph == nullptrgraph == nullptrgraph == nullptr"<<graph;
            return;
        }
        QCPPlottableLegendItem *item = ui->QcustomWidget->legend->itemWithPlottable(graph);
       qDebug()<<"slot_SelectionChanged"<<item->selected()<<graph->selected();
        if(item->selected() || graph->selected())   //选中了哪条曲线或者曲线的图例
        {
            m_tracerGraph = graph;
            if(m_tracer != nullptr)
            {
                m_tracer->setGraph(m_tracerGraph);
            }
            item->setSelected(true);
            QPen pen;
            pen.setWidth(1);   //设置选中时的线宽 建议宽度设为1,如果数据量很大,界面会卡顿
            pen.setColor(Qt::blue);
            m_chooseFlag = true;
            qDebug()<<"m_chooseFlagm_chooseFlag"<<m_chooseFlag;
            graph->selectionDecorator()->setPen(pen);
            graph->setSelection(QCPDataSelection(graph->data()->dataRange()));
            return;
        }
        else if(!item->selected() && !graph->selected())
        {
            item->setSelected(false);
            m_chooseFlag=false;

        }
    }
}
3.数据处理线程
这里主要就是读二进制文件,然后进行了快速傅里叶变化,输出了一下频谱。
.h 文件
#define QCUSTOMTHREAD_H
#include <QObject>
#include <QThread>
#include <QVector>
#include "fftw3.h"
class QCustomThread : public QThread
{
    Q_OBJECT
public:
    explicit QCustomThread(QObject *parent = nullptr);
    ~QCustomThread();
    void run();
    void GetFileName(QString str);

private:
    void ProcessTheFile();
    void SetFFt();
    void GetFFtData(QVector<double>fftin,QVector<double>&fftVecX,QVector<double>&fftVercY);
    void GetData(int channal);
public:
    double m_FileSize;
    double m_FileSizeStart;
    double m_FileSizeEnd;
    int    m_Channels;
    bool   m_bFFT;
    QString m_strFileName;
    bool bStartFlag;
    QVector<double>ChannelOut_1;
    QVector<double>ChannelOut_2;
    QVector<double>ChannelOut_X;
private:
    QByteArray m_bytFileData;
    QVector<double>mFftIndices;
    QVector<double> mSamples;
    QVector<double> mIndices;
    fftw_plan mFftPlan;
    double *mFftIn;
    double *mFftOut;

public slots:
signals:
    void SendDataToPlot(QVector<double> data1,QVector<double> data2,QVector<double>datax);
};
.cpp文件
使用FFTW3库进行快速傅里叶变换的代码很多,我这里主要进行一个测试。
void QCustomThread::SetFFt()
{
    double freqStep = (double)SAMPLE_FREQ / (double)NUM_SAMPLES;
    double f = AUDIBLE_RANGE_START;
    while (f < AUDIBLE_RANGE_END) {
        mFftIndices.append(f);
        f += freqStep;
    }
    /* Set up FFT plan */
    mFftIn  = fftw_alloc_real(NUM_SAMPLES);
    mFftOut = fftw_alloc_real(NUM_SAMPLES);
    mFftPlan = fftw_plan_r2r_1d(NUM_SAMPLES, mFftIn, mFftOut, FFTW_R2HC,FFTW_ESTIMATE);
}
void QCustomThread::GetFFtData(QVector<double>fftin,QVector<double>&fftVecX,QVector<double>&fftVercY)
{
    int FFTWN = fftin.size();
    int FFTWNFs = 100000;    //采集频率,1000hZ
    QVector<double> data_power_x;
    double *in;
    fftw_complex *out;
    fftw_plan my_plan;
    in = (double *)fftw_malloc(sizeof( double) * FFTWN);
    out = (fftw_complex *)fftw_malloc(sizeof(fftw_complex) * FFTWN);
    for (int i = 0; i <FFTWN; i++)
    {
        in[i] = fftin[i];
    }
       my_plan = FFTW3_H::fftw_plan_dft_r2c_1d(FFTWN, in, out, FFTW_ESTIMATE);
    fftw_execute(my_plan);
    for( int i = 0; i < FFTWN/2+1; i++)
    {
     fftVercY.append((out[i][0] * out[i][0] + out[i][1] * out[i][1])/(FFTWNFs*FFTWN));
     fftVecX.append((double)FFTWNFs / FFTWN*i);
    }
    fftw_destroy_plan(my_plan);
    fftw_free(in);
    fftw_free(out);
}
4.Matlab验证代码
%  读取二进制文件,filename为二进制文件
clc;
N=2500000;
fs=50000000;
Ts=1/fs;%采样时间间隔
fid=fopen('E:/syh/sti.dat');  %读取指定的.dat文件
rec = fread(fid,'*int16');   %将读取结果保存在参数rec中
fclose(fid);
plot(rec);

% y=fft(rec,N);
% f=(0:N-1)'*fs/N;
% stem(f,abs(y));
五、后记
在Ubuntu上进行库编译相比Window的库编译还是有点困难可能很少接触这方面,简单验证了一下FFTW3的使用,感觉matlab和qt程序出来还是有一点差异,还得排查一下原因。QCustomPlot网上的例子很多也借鉴学习了很多,之前主要用QWT的多一点,最后磕磕绊绊还是解决了问题。具体的细节还有待完善。


 8282
8282


 被折叠的 条评论
为什么被折叠?
被折叠的 条评论
为什么被折叠?
 到【灌水乐园】发言


