


一、数据库压力测试,sysbench支持多种数据库类型,包括pg、oracle、mysql等。
step 1:sysbench源码安装
下载地址:
https://github.com/akopytov/sysbench
step 2:解压压缩包
unzip sysbench-master.zip
step 3:预编译,指定使用pg模块(已安装pg),不使用mysql模块
cd sysbench-master
./autogen.sh
./configure --with-pgsql --without-mysql`
step 4:安装
make -j
make install
step 5:将测试数据库写入数据库,需要切换成pg的用户。
su - pgsql
sysbench /usr/local/share/sysbench/oltp_common.lua --db-driver=pgsql \
--pgsql-host=192.168.71.88 --pgsql-port=5432 \
--pgsql-user=jxkh --pgsql-password=jxkh --pgsql-db=postgres  \
--table-size=1000000 --tables=10 --threads=100 \
--events=999999999 --time=60 prepare
注:
table-size 写入表中的数据量
tables 写入数据库中的表数
threads 线程数
step 6:生成测试数据
sysbench /usr/local/share/sysbench/oltp_read_write.lua --db-driver=pgsql \
--pgsql-host=192.168.71.88 --pgsql-port=5432 \
--pgsql-user=jxkh --pgsql-password=jxkh --pgsql-db=postgres  \
--table-size=1000000 --tables=10 --threads=20 \
--events=999999999 --time=60 --report-interval=10 \
--db-ps-mode=disable --forced-shutdown=1 run > /tmp/sysbench_log/21.log
step 7:查看报告
在这里插入图片描述
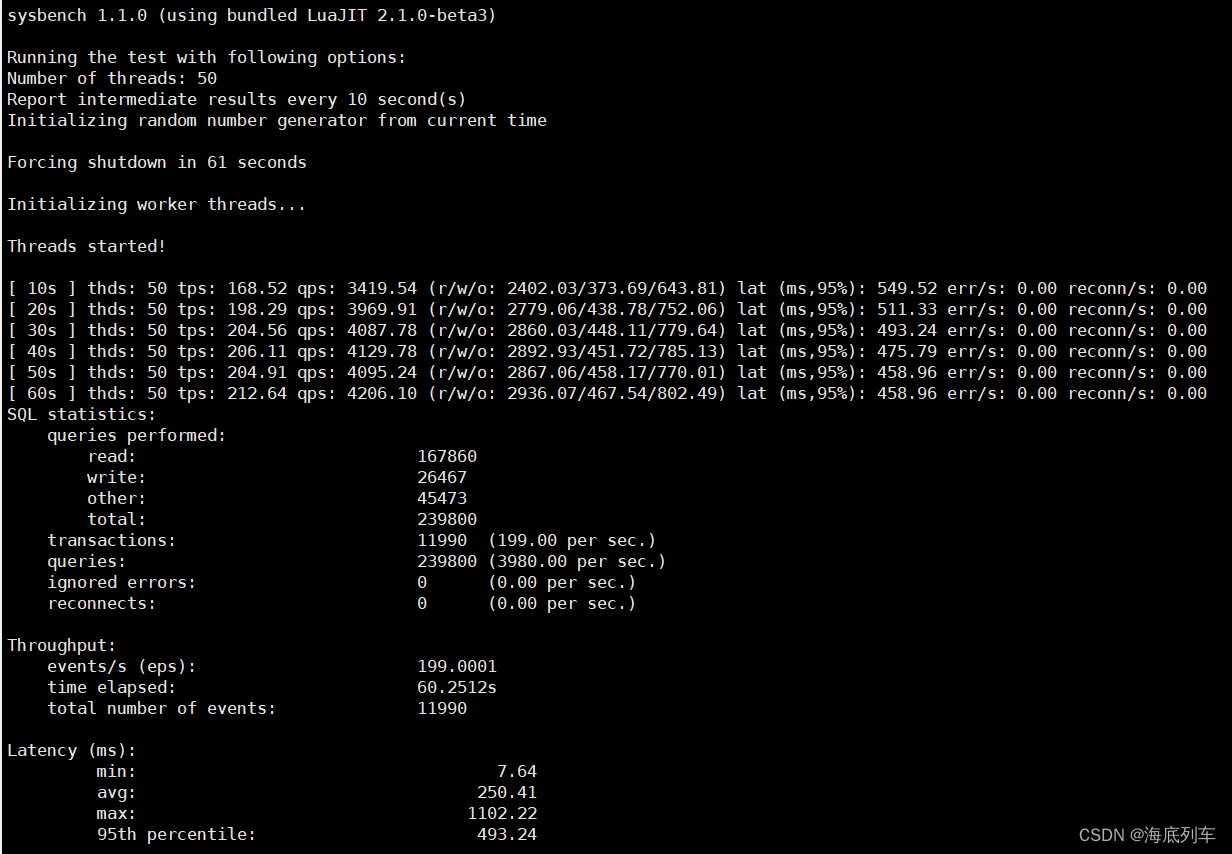
[ 10s ] thds: 50 tps: 168.52 qps: 3419.54 (r/w/o: 2402.03/373.69/643.81) lat (ms,95%): 549.52 err/s: 0.00 reconn/s: 0.00
[ 20s ] thds: 50 tps: 198.29 qps: 3969.91 (r/w/o: 2779.06/438.78/752.06) lat (ms,95%): 511.33 err/s: 0.00 reconn/s: 0.00
[ 30s ] thds: 50 tps: 204.56 qps: 4087.78 (r/w/o: 2860.03/448.11/779.64) lat (ms,95%): 493.24 err/s: 0.00 reconn/s: 0.00
[ 40s ] thds: 50 tps: 206.11 qps: 4129.78 (r/w/o: 2892.93/451.72/785.13) lat (ms,95%): 475.79 err/s: 0.00 reconn/s: 0.00
[ 50s ] thds: 50 tps: 204.91 qps: 4095.24 (r/w/o: 2867.06/458.17/770.01) lat (ms,95%): 458.96 err/s: 0.00 reconn/s: 0.00
[ 60s ] thds: 50 tps: 212.64 qps: 4206.10 (r/w/o: 2936.07/467.54/802.49) lat (ms,95%): 458.96 err/s: 0.00 reconn/s: 0.00
注:
thds:50,这个意思就是有 50 个线程在压测
tps:212.64,这个意思就是每秒执行了 212.64 个事务
qps:4206.10,这个意思就是每秒可以执行 4206.10个请求
(r/w/o: 2936.07/467.54/802.49):这个意思就是说,在每秒 4206.10 个请求中,有 2936.07个请求是读请求,467.54 个请求是写请求,802.49 个请求是其他的请求,就是对 QPS 进行了拆解
lat (ms, 95%):20,这个意思就是说,95% 的请求的延迟都在 20 毫秒以下
err/s: 0.00 reconn/s: 0.00:这两个的意思就是说,每秒有 0 个请求是失败的,发生了 0 次网络重连
SQL statistics:
    queries performed:
        read:                            167860
        write:                           26467
        other:                           45473
        total:                           239800
    transactions:                        11990  (199.00 per sec.)
    queries:                             239800 (3980.00 per sec.)
    ignored errors:                      0      (0.00 per sec.)
    reconnects:                          0      (0.00 per sec.)
注:压测期间一共执行了167860次读请求,26467次写请求,45473次其他请求,请求总数为239800,一共执行了11990个事务,每秒执行199个事务,一共执行239800个请求,每秒执行3980个请求,没有请求失败和重连。
Throughput:
    events/s (eps):                      199.0001
    time elapsed:                        60.2512s
    total number of events:              11990
注:每秒执行199.0001个事务,耗时60.2512s,总事务数11990。
Latency (ms):
         min:                                    7.64
         avg:                                  250.41
         max:                                 1102.22
         95th percentile:                      493.24
         sum:                              3002379.68
注:这部分数据统计的是线程真正执行的时间,总共3002379.68ms, 单次执行最少时间为7.64ms,
最多时间为1102.22ms, 平均时间为250.41ms, 95%次的执行时间在493.24ms左右;
Threads fairness:
    events (avg/stddev):           239.8000/14.46
    execution time (avg/stddev):   60.0476/0.08
注:线程 执行平均次数为239.8次,执行时间为60.0476s;
step 8:删除测试数据
sysbench /usr/local/share/sysbench/oltp_common.lua --db-driver=pgsql \
--pgsql-host=192.168.71.88 --pgsql-port=5432 \
--pgsql-user=jxkh --pgsql-password=jxkh --pgsql-db=postgres  \
--table-size=1000000 --tables=10 --threads=100 \
--events=999999999 --db-ps-mode=disable cleanup
二、web压力测试
step 1:apache benchmark源码安装,apache benchmark是apache的一个组件,因此需要安装apache。
下载地址:
https://downloads.apache.org/httpd/
依赖下载地址:https://downloads.apache.org/apr/
step 2:解压压缩包
tar -zxvf apr-1.7.4.tar.gz
tar -zxvf apr-util-1.6.3.targz
tar -zxvf httpd-2.4.59.tar.gz
step 3:编译安装
cd apr-1.7.4
./configure
make && make install
cd apr-util-1.6.3
./configure
make && make install
cd httpd-2.4.59
./configure --enable-layout=Apache
make && make install
step 4:添加环境变量
vim /etc/profile
export APACHE_HOME=/usr/local/apache2
export PATH=$PATH:$APACHE_HOME/bin
source /etc/profile
step 5:开始压测,处理10000个请求并运行1000次login.html文件
ab -c 1000 -n 10000 http://x.x.x.x:x/login.html
step 6:结果分析
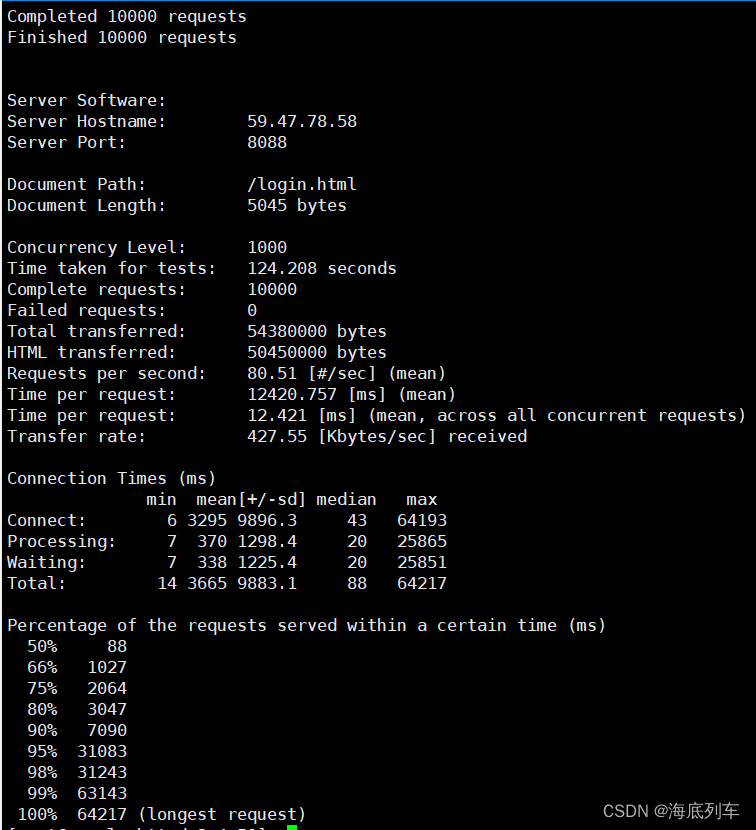
Document Path:          /login.html
Document Length:        5045 bytes
注:
请求的URL中的根绝对路径为/,该请求的类型为html,HTTP响应数据的正文长度5045 bytes。
Concurrency Level:      1000
Time taken for tests:   124.208 seconds
Complete requests:      10000
Failed requests:        0
Total transferred:      54380000 bytes
HTML transferred:       50450000 bytes
Requests per second:    80.51 [#/sec] (mean)
Time per request:       12420.757 [ms] (mean)
Time per request:       12.421 [ms] (mean, across all concurrent requests)
Transfer rate:          427.55 [Kbytes/sec] received
注:
并发用户数为1000,所有请求的总耗时为124.208s,请求总数10000,请求失败0,响应数据长度总和54380000 bytes,响应数据中正文数据的总和50450000 bytes,吞吐率80.51,用户平均请求等待时间12420.757 ms,服务器平均请求等待时间12.421ms,单位时间内从服务器获取的数据长度427.55。
EOF


 5万+
5万+

 被折叠的 条评论
为什么被折叠?
被折叠的 条评论
为什么被折叠?
 到【灌水乐园】发言


