


 本文介绍了在深度学习模型的语义分割任务中,如何计算并可视化DeeplabV3+的评价指标,包括IoU、像素精度、召回率和精确度。通过`show_results()`函数,将这些指标以柱状图形式展示出来,并保存为图片。同时,混淆矩阵以CSV格式保存,方便进一步分析。最后,展示了各项指标的可视化结果。
1 评价指标可视化用在何处
在文章DeeplabV3+计算评价指标中给出了分割模型的评价指标有哪些,以及如何计算,在得到验证集的各项指标后,没点可视化操作显得不够专业,故增加此文。
if __name__ == "__main__":
        # --------------------------------------------------------#
        #   hist:验证集的混淆矩阵,shape:(21,21)
        #   IoUs:每个类别的IoU,shape:(21,)
        #   PA_Recall:每个类别的像素精度召回率(行和),shape:(21,)
        #   Precision:每个类别的像素精度(列和),shape:(21,)
        #	每一行之和是该类的真实样本数量,每一列之和是预测为该类的样本数量。
        # --------------------------------------------------------#
        hist, IoUs, PA_Recall, Precision = compute_mIoU(gt_dir, pred_dir, image_ids, num_classes, name_classes)  # 执行计算评价指标的函数
        # --------------------------------------------------------#
        #   miou_out_path:输出结果路径
        # --------------------------------------------------------#
        show_results(miou_out_path, hist, IoUs, PA_Recall, Precision, name_classes)
2 show_results()代码理解
import csv
import os
from os.path import join
import matplotlib.pyplot as plt
import numpy as np
from PIL import Image
def adjust_axes(r, t, fig, axes):
bb = t.get_window_extent(renderer=r)
text_width_inches = bb.width / fig.dpi
current_fig_width = fig.get_figwidth()
new_fig_width = current_fig_width + text_width_inches
propotion = new_fig_width / current_fig_width
x_lim = axes.get_xlim()
axes.set_xlim([x_lim[0], x_lim[1] * propotion])
def draw_plot_func(values, name_classes, plot_title, x_label, output_path, tick_font_size = 12, plt_show = True):
"""
values: 一维列表
name_classes: 种类名称,例如这样:["_background_","cat","dog",...]
"""
fig = plt.gcf() # 获得当前图表
axes = plt.gca() # 获得当前子图
# --------------------------------------------#
# plt.bar: 正常纵向柱状图
# plt.barh: 横向柱状图
# 参数:纵坐标有哪些,每个有多宽(高),颜色
# --------------------------------------------#
plt.barh(range(len(values)), values, color='royalblue')
plt.title(plot_title, fontsize=tick_font_size + 2)
plt.xlabel(x_label, fontsize=tick_font_size)
# name_classes:种类名称,例如这样:["_background_","cat","dog",...]
plt.yticks(range(len(values)), name_classes, fontsize=tick_font_size)
r = fig.canvas.get_renderer() # <matplotlib.backends.backend_agg.RendererAgg object at 0x00000244FFFFA550>
for i, val in enumerate(values):
str_val = " " + str(val)
if val < 1.0:
str_val = " {0:.2f}".format(val)
# -----------------------------------------------------#
# plt.text:用于设置文字说明
# 参数:前两个参数组成说明文字的横纵坐标,三参:说明文字
# -----------------------------------------------------#
t = plt.text(val, i, str_val, color='royalblue', va='center', fontweight='bold')
if i == (len(values)-1):
adjust_axes(r, t, fig, axes) # 用于调整坐标参数
fig.tight_layout() # 自动调整子图参数,让图显示好看点
fig.savefig(output_path)
if plt_show:
plt.show()
plt.close()
def show_results(miou_out_path, hist, IoUs, PA_Recall, Precision, name_classes, tick_font_size = 12):
# -------------------------------------------------------#
# IoUs: 每个类别的IoU,shape:(21,)
# PA_Recall: 每个类别的像素精度召回率(行和),shape:(21,)
# Precision: 每个类别的像素精度(列和),shape:(21,)
# name_classes:种类名称,例如这样:["_background_","cat","dog",...]
# "mIoU = {0:.2f}%".format(np.nanmean(IoUs)*100):图片标题
# "Intersection over Union":横坐标
# os.path.join(miou_out_path, "mIoU.png"):保存路径
# -------------------------------------------------------#
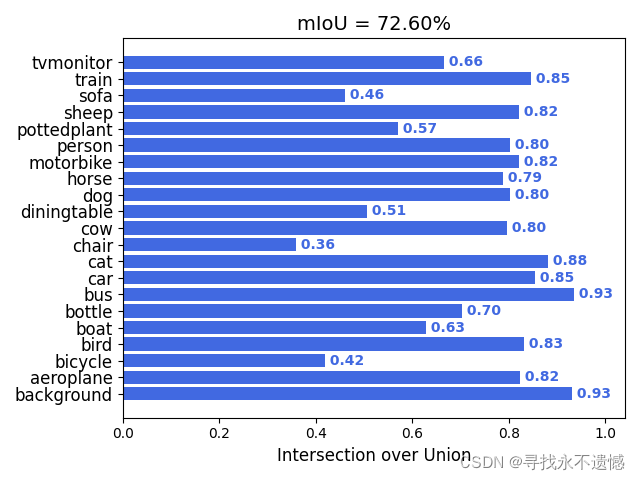
draw_plot_func(IoUs, name_classes, "mIoU = {0:.2f}%".format(np.nanmean(IoUs)*100), "Intersection over Union", \
os.path.join(miou_out_path, "mIoU.png"), tick_font_size = tick_font_size, plt_show = True)
print("Save mIoU out to " + os.path.join(miou_out_path, "mIoU.png"))
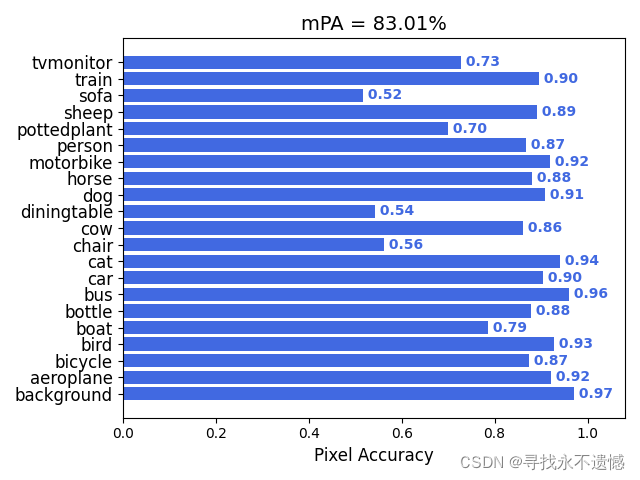
draw_plot_func(PA_Recall, name_classes, "mPA = {0:.2f}%".format(np.nanmean(PA_Recall)*100), "Pixel Accuracy", \
os.path.join(miou_out_path, "mPA.png"), tick_font_size = tick_font_size, plt_show = False)
print("Save mPA out to " + os.path.join(miou_out_path, "mPA.png"))
draw_plot_func(PA_Recall, name_classes, "mRecall = {0:.2f}%".format(np.nanmean(PA_Recall)*100), "Recall", \
os.path.join(miou_out_path, "Recall.png"), tick_font_size = tick_font_size, plt_show = False)
print("Save Recall out to " + os.path.join(miou_out_path, "Recall.png"))
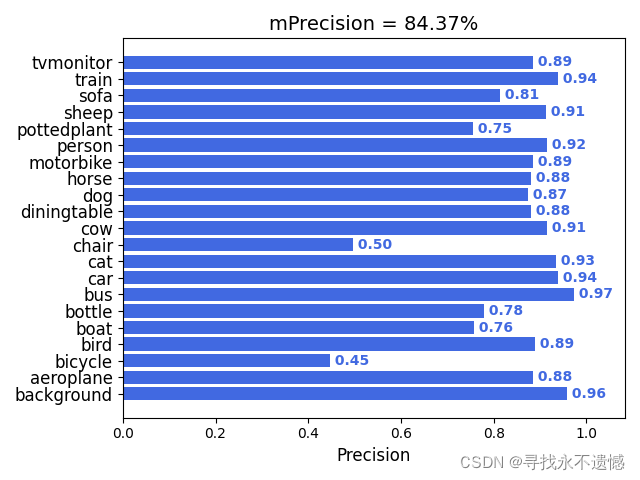
draw_plot_func(Precision, name_classes, "mPrecision = {0:.2f}%".format(np.nanmean(Precision)*100), "Precision", \
os.path.join(miou_out_path, "Precision.png"), tick_font_size = tick_font_size, plt_show = False)
print("Save Precision out to " + os.path.join(miou_out_path, "Precision.png"))
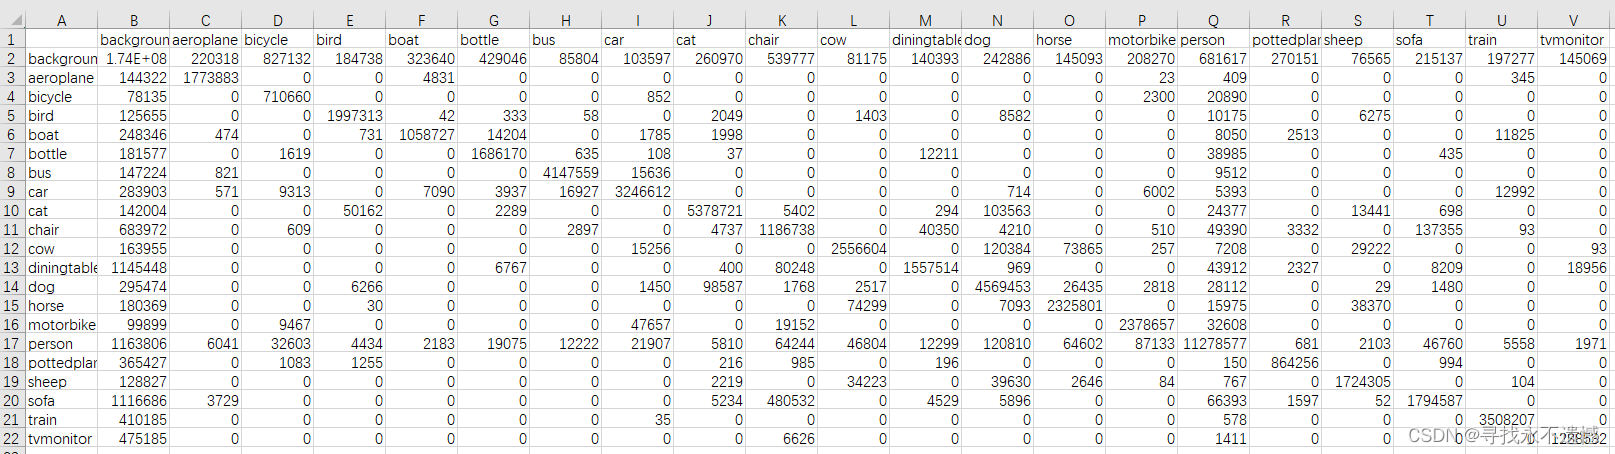
with open(os.path.join(miou_out_path, "confusion_matrix.csv"), 'w', newline='') as f:
writer = csv.writer(f)
writer_list = []
writer_list.append([' '] + [str(c) for c in name_classes]) # 往csv文件里写坐标名称
for i in range(len(hist)): # 逐行读写混淆矩阵参数
writer_list.append([name_classes[i]] + [str(x) for x in hist[i]]) # 里面的for逐列
writer.writerows(writer_list)
print("Save confusion_matrix out to " + os.path.join(miou_out_path, "confusion_matrix.csv"))
3 输出结果展示
confusion_matrix.csv内容
MIoU.png内容
mPA.png内容
Precision.png内容
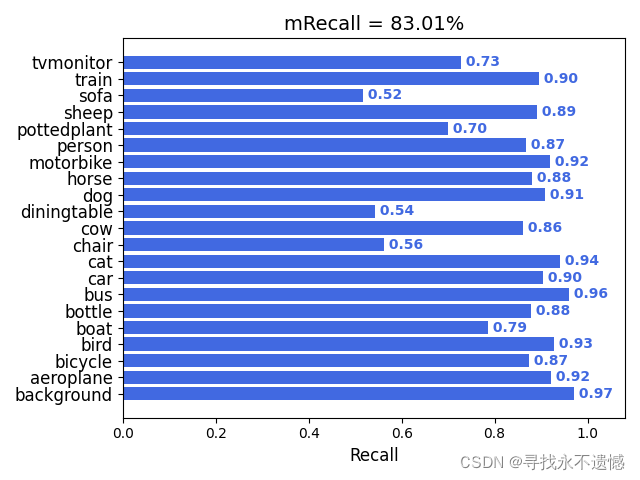
Recall.png内容
4 感谢链接
https://blog.csdn.net/weixin_44791964/article/details/120113686


 被折叠的 条评论
为什么被折叠?
被折叠的 条评论
为什么被折叠?
 到【灌水乐园】发言


