


文章目录
配置
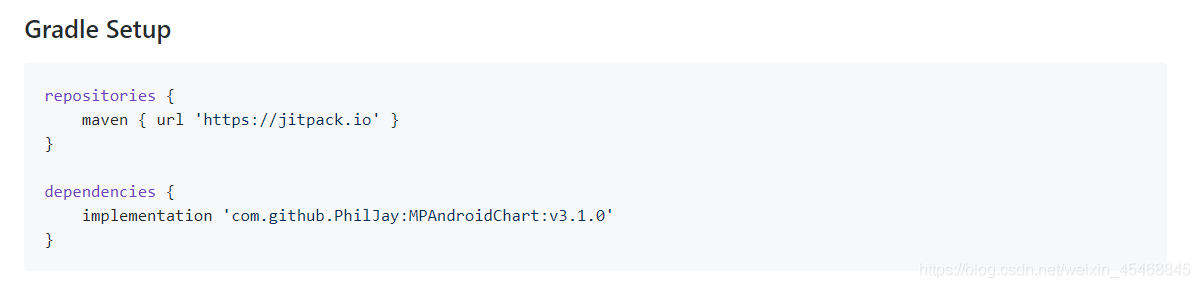
首先在Android 配置MPAndroidChart
git官网上给的提示是:
repositories {

    maven {
    url 'https://jitpack.io' }
}

dependencies {

    implementation 'com.github.PhilJay:MPAndroidChart:v3.1.0'
}
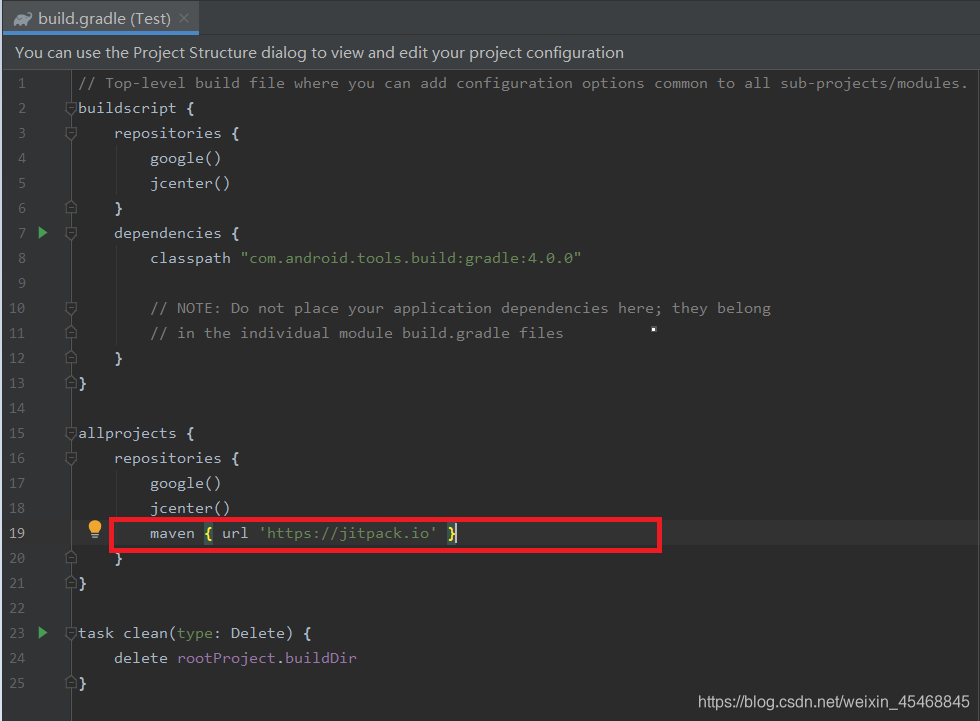
这并不是在一个文件中配置,不要添加错了:
在porject /bulid.gradle中:
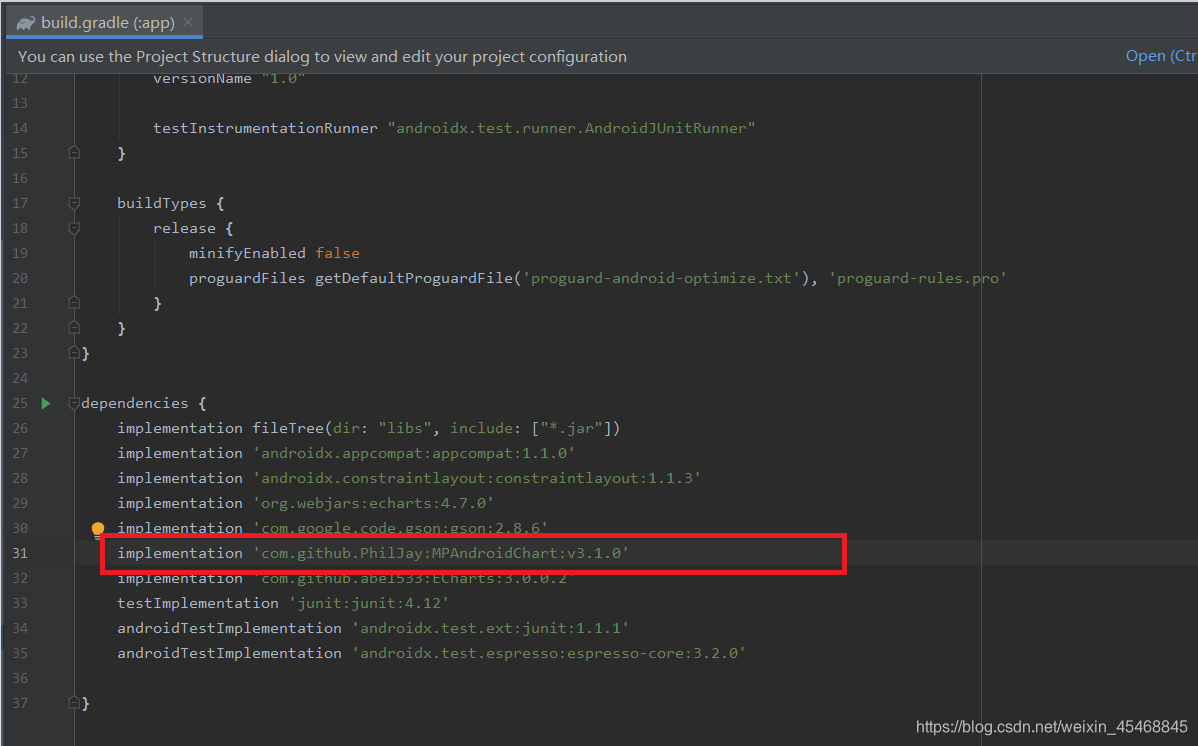
app/bulid.gradle:
基本属性
图表类有共同的特点
X轴:XAxis
1.得到x轴
XAxis xAxis = lineChart.getXAxis();
2.设置x轴位置
可选值:BOTTOM,BOTH_SIDED,BOTTOM_INSIDE,TOP,TOP_INSIDE
xAxis.setPosition(XAxis.XAxisPosition.BOTH_SIDED);
3.设置X轴坐标之间的最小间隔
xAxis.setGranularity(1f);
4.设置x轴的刻度数量
//第二个参数表示是否被平均分配
//xAxis.setLabelCount(12,true);
5.设置x轴的最小值最大值,系统根据刻度数量自动分配刻度显示
xAxis.setAxisMinimum(0f);
xAxis.setAxisMaximum(100f);
6.设置x轴为字符串
xAxis.setValueFormatter(new IndexAxisValueFormatter() {

    @Override
    public String getFormattedValue(float value) {

        return super.getFormattedValue(value);
    }
});
Y轴:YAxis
1.得到Y轴
        //YAxis leftAxis = lineChart.getAxis(YAxis.AxisDependency.LEFT);
        YAxis leftAxis = lineChart.getAxisLeft();

        //YAxis rAxis = lineChart.getAxis(YAxis.AxisDependency.RIGHT);
        YAxis rightAxis = lineChart.getAxisRight();
2.设置从Y轴值
leftYAxis.setAxisMinimum(0f);
leftYAxis.setAxisMaximum(100f);

rightYAxis.setAxisMinimum(0f);
rightYAxis.setAxisMaximum(100f);
3.设置Y轴是否显示(效果如上右图)
rightYAxis.setEnabled(false); //右侧Y轴不显示
4.X轴和Y轴类似,都具有相同的属性方法
rightYAxis.setGranularity(1f);
rightYAxis.setLabelCount(11,false);
rightYAxis.setTextColor(Color.BLUE); //文字颜色
rightYAxis.setGridColor(Color.RED); //网格线颜色
rightYAxis.setAxisLineColor(Color.GREEN); //Y轴颜色
5.限制线LimitLine(如上右图)
LimitLine limitLine = new LimitLine(95,"高限制性"); //得到限制线
limitLine.setLineWidth(4f); //宽度
limitLine.setTextSize(10f);
limitLine.setTextColor(Color.RED);  //颜色
limitLine.setLineColor(Color.BLUE);
rightYAxis.addLimitLine(limitLine); //Y轴添加限制线
6.自定义y轴
图例:Legend
1.得到Lengend
Legend legend = mLineChart.getLegend();
2.设置Lengend颜色
legend.setTextColor(Color.CYAN); //设置Legend 文本颜色
3.设置Lengend位置
legend.setVerticalAlignment(Legend.LegendVerticalAlignment.BOTTOM);
legend.setHorizontalAlignment(Legend.LegendHorizontalAlignment.CENTER);
legend.setOrientation(Legend.LegendOrientation.HORIZONTAL);
4.设置标签是否换行
true换行,false 不换行
legend.setWordWrapEnabled(true);
5.隐藏Lengend
legend.setEnabled(false);
描述:Description
1.隐藏描述
Description description = new Description();
description.setEnabled(false);
lineChart.setDescription(description);
2.设置描述内容
Description description = new Description();
description.setText("X轴描述");
description.setTextSize(45);//字体大小
description.setTextColor(Color.RED);//字体颜色
lineChart.setDescription(description);//
限制线:LimitLine
两个轴都支持所谓的 LimitLines,它允许表达特殊信息,如边界或约束。添加到 YAxis 的 LimitLines 绘
制在水平方向上,在添加到 XAxis 时在垂直方向上绘制。这是您从轴添加和删除 LimitLines 的方法:
- addLimitLine(LimitLine l):向此轴添加新的 LimitLine。
- removeLimitLine(LimitLine l):从此轴移除指定的 LimitLine。
- 更多添加/删除方法同样也可用。
- setDrawLimitLinesBehindData(boolean enabled):允许控制 LimitLines 和实际数据之间的顺序。如果将此值设置为 true,则会在实际数据后面绘制 LimitLines,否则将在前面绘制。默认值:
false
边界或限制线(类 LimitLine)是(顾名思义)简单明了的线,用于为用户提供附加信息。
举个例子,在用户登录用的应用程序中,图表可能会显示各种血压测量结果。 为了让用户知道超过
140mmHg 的血压是被认为是一个健康风险的用户,可以添加一个 140 的 LimitLine 来提供该信息。示例代
码 。
示例代码

MarkerView
MarkerView可自定义,用于点击图标值时显示想要的内容 效果如上右图
1.自定义MarkerView
public class MyMarkerView extends MarkerView {


    private TextView tvContent;
    private DecimalFormat format = new DecimalFormat("##0");

    public MyMarkerView(Context context) {

        super(context, R.layout.layout_markerview);
        tvContent = (TextView) findViewById(R.id.tvContent);
    }

    @Override
    public void refreshContent(Entry e, Highlight highlight) {

        tvContent.setText(format.format(e.getY()));
        super.refreshContent(e, highlight);
    }

    @Override
    public MPPointF getOffset() {

        return new MPPointF(-(getWidth() / 2), -getHeight() - 10);
    }
}
2.设置显示MarkerView
MyMarkerView mv = new MyMarkerView(this);
lineChart.setMarkerView(mv);
折线图的线条设置
//一个LineDataSet就是一条线
LineDataSet lineDataSet = new LineDataSet(entries, "温度");
//设置曲线值的圆点是实心还是空心
lineDataSet.setDrawCircleHole(false);
//设置显示值的字体大小
lineDataSet.setValueTextSize(9f);
//线模式为圆滑曲线(默认折线)
lineDataSet.setMode(LineDataSet.Mode.CUBIC_BEZIER);
折线图
案例:
布局:
<?xml version="1.0" encoding="utf-8"?>
<LinearLayout
    xmlns:android="http://schemas.android.com/apk/res/android"
    android:layout_width="match_parent"
    android:layout_height="match_parent"
    android:orientation="vertical">

    <com.github.mikephil.charting.charts.LineChart
        android:id="@+id/lineChart"
        android:layout_width="match_parent"
        android:layout_height="300dp"
        android:layout_centerInParent="true"/>
</LinearLayout>
MainActivity.main
public class MainActivity extends AppCompatActivity {


    LineChart lineChart;

    @Override
    protected void onCreate(Bundle savedInstanceState) {

        super.onCreate(savedInstanceState);
        setContentView(R.layout.activity_main);
        lineChart = (LineChart) findViewById(R.id.lineChart);
        lineChart.setDrawBorders(true);

        //设置数据
        List<Entry> entries = new
最低0.47元/天 解锁文章


 6100
6100


 被折叠的 条评论
为什么被折叠?
被折叠的 条评论
为什么被折叠?
 到【灌水乐园】发言


