


环境
echarts@4.1.0
<template>
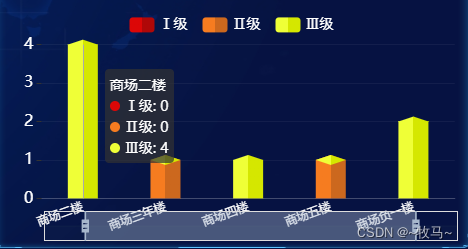
<!-- 商场各楼层统计 -->
<div id="threethree"></div>
</template>
<script>
import * as echarts from "echarts"
export default {
    name:"",
    components:{},
    data(){
        return {

        }
    },
    methods:{
        getdata(){
            var myCharts = echarts.init(document.getElementById('threethree'))
            // mock 数据
            const dataArr = {
                xdata: ['商场一楼', '商场二楼', '商场三年楼', '商场四楼', '商场五楼', '商场负一楼',],
                result: [
                    { name: 'Ⅰ级', data: [0, 0, 0, 0, 0, 0, ] },
                    { name: 'Ⅱ级', data: [1, 0, 1, 0, 1, 0, ] },
                    { name: 'Ⅲ级', data: [1, 4, 0, 1, 0, 2, ] },
                    // { name: 'Ⅳ级', data: [5, 3, 6, 4, 2, 1, 4, 4, 10] },
                ]
            }
            // 头部菱形
            const diamondData = dataArr.result.reduce((pre, cur, index) => {
                pre[index] = cur.data.map((el, id) => el + ( pre[index - 1] ? pre[index - 1][id] : 0))
                return pre
            }, [])

            // color
            const color = [
                [{ offset: 0, color: "#dc0707", }, { offset: 0.5, color: "#dc0707", }, { offset: 0.5, color: "#af0808", }, { offset: 1, color: "#af0808", }],
                [{ offset: 0, color: "#f67c20", }, { offset: 0.5, color: "#f67c20", }, { offset: 0.5, color: "#cc681e", }, { offset: 1, color: "#cc681e", }],
                [{ offset: 0, color: "#efff37", }, { offset: 0.5, color: "#efff37", }, { offset: 0.5, color: "#d5e700", }, { offset: 1, color: "#d5e700", }],
                [{ offset: 0, color: "#6495ED", }, { offset: 0.5, color: "#6495ED", }, { offset: 0.5, color: "#6495ED", }, { offset: 1, color: "#4169E1", }],
                [{ offset: 0, color: "#46c9ff", }, { offset: 0.5, color: "#46c9ff", }, { offset: 0.5, color: "#00b4ff", }, { offset: 1, color: "#00b4ff", }],
                [{ offset: 0, color: "#54a0ff", }, { offset: 0.5, color: "#54a0ff", }, { offset: 0.5, color: "#1f83ff", }, { offset: 1, color: "#1f83ff", }],
            ]

            // series
            let series = dataArr.result.reduce((p, c, i, array) => {
                p.push({
                    z: i + 1,
                    stack: '总量',
                    type: 'bar',
                    name: c.name,
                    barGap: '-100%',
                    barWidth: 30,
                    data: c.data,
                    itemStyle:{ color: { type: 'linear', x: 0, x2: 1, y: 0, y2: 0, colorStops: color[i] } },
                },{
                    z: i + 10,
                    type: 'pictorialBar',
                    symbolPosition: 'end',
                    symbol: 'diamond',
                    symbolOffset: [0, '-50%'],
                    symbolSize: [30, 10],
                    data: diamondData[i],
                    itemStyle: { color: { type: 'linear', x: 0, x2: 1, y: 0, y2: 0, colorStops: color[i] } },
                    tooltip: { show: false },
                })

                // 是否最后一个了?
                if (p.length  === (array.length) * 2) {
                    p.push({
                        z: array.length * 2,
                        type: "pictorialBar",
                        symbolPosition: "start",
                        data: dataArr.result[0].data,
                        symbol: "diamond",
                        symbolOffset: ["0%", "50%"],
                        symbolSize: [30, 10],
                        itemStyle: { color: { type: 'linear', x: 0, x2: 1, y: 0, y2: 0, colorStops: color[0]} },
                        tooltip: { show: false },
                    })
                    return p
                }

                return p
            }, [])

            // tooltip
            const tooltip = { trigger: "axis" }

            // legend
            const legend = {
                data: dataArr.result.map(item => item.name),
                textStyle: { fontSize: 14, color: '#fff'},
                itemWidth: 25,
                itemHeight: 15,
                itemGap: 15,
                top: '5%',
            }
            // grid
            const grid = { top: '18%', left: '10%', right: '3%', bottom: '20%'}

            // xAxis
            const xAxis = {
                axisTick: { show: false },
                axisLine: { lineStyle: { color: 'rgba(255,255,255, .2)' } },
                axisLabel: { textStyle: { fontSize: 12, color: '#fff'  },interval:0,rotate:20, },
                data: dataArr.xdata
            }

            // yAxis
            const yAxis = [{
                splitLine: { lineStyle: { color: 'rgba(255,255,255, .05)' } },
                axisLine: { show: false, },
                axisLabel: { textStyle: { fontSize: 16, color: '#fff' } }
            }]

            const dataZoom = [{ // 缩放条
                    type: 'inside',
                    start: 10,
                    end: 90
                    }, {
                    start: 30,
                    end: 80
                }]

            // 渲染
            let option = { tooltip, xAxis, yAxis, series, grid, legend, dataZoom, backgroundColor:'' }
            myCharts.setOption(option)
        }
    },
    mounted(){
        this.getdata()
    }
}
</script>
<style>
    #threethree { width: 100%; height: 27vh; }
</style>


 767
767


 被折叠的 条评论
为什么被折叠?
被折叠的 条评论
为什么被折叠?
 到【灌水乐园】发言


