


joyful pandas 综合练习上
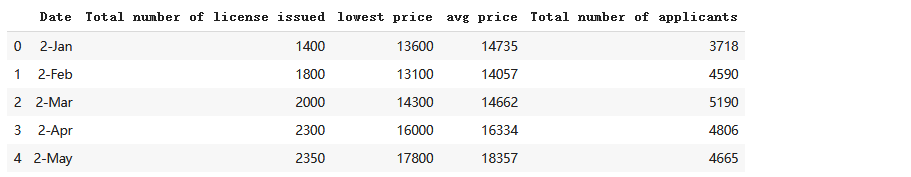
一、2002 年-2018 年上海机动车拍照拍卖
问题
(1) 哪一次拍卖的中标率首次小于 5%?
(2) 按年统计拍卖最低价的下列统计量:最大值、均值、0.75 分位数,要求显示在同一张表上。
(3) 将第一列时间列拆分成两个列,一列为年份(格式为 20××),另一列为月份(英语缩写),添加到列表作为第一第二列,并将原表第一列删除,其他列依次向后顺延。
(4) 现在将表格行索引设为多级索引,外层为年份,内层为原表格第二至第五列的变量名,列索引为月份。
(5) 一般而言某个月最低价与上月最低价的差额,会与该月均值与上月均值的差额具有相同的正负号,哪些拍卖时间不具有这个特点?
(6) 将某一个月牌照发行量与其前两个月发行量均值的差额定义为发行增益,最初的两个月用 0 填充,求发行增益极值出现的时间。
import numpy as np
import pandas as pd
from collections import OrderedDict
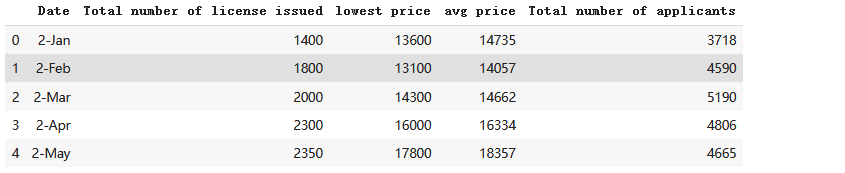
df_car = pd.read_csv('2002年-2018年上海机动车拍照拍卖.csv')
df_car.head()
df_car.info()

##(1) 哪一次拍卖的中标率首次小于 5%?
df_car_1 = df_car.copy()
df_car_1 = df_car.assign(probability=df_car['Total number of license issued'] / df_car['Total number of applicants'])
df_car_1[df_car_1['probability']<0.05].head(1)

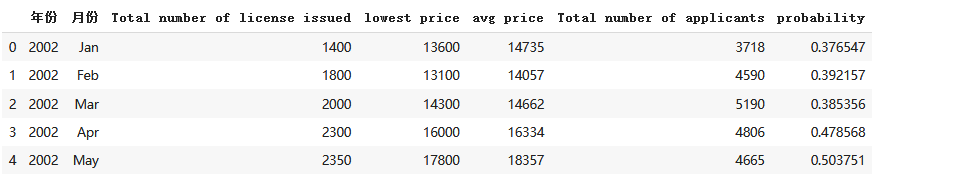
'''(3) 将第一列时间列拆分成两个列,一列为年份(格式为 20××),另一列为月份(英语缩写),
添加到列表作为第一第二列,并将原表第一列删除,其他列依次向后顺延。'''
df_car_1['年份'] = df_car_1['Date'].apply(lambda x : 2000+int(x.split('-')[0]))
df_car_1['月份'] = df_car_1['Date'].apply(lambda x : x.split('-')[1])
newcolumns = ['年份','月份']+list(df_car_1.columns[1:-2])
df_3 = df_car_1.reindex(columns=newcolumns).copy()
df_3.head()A
#(2) 按年统计拍卖最低价的下列统计量:最大值、均值、0.75 分位数,要求显示在同一张表上。
year = df_3.groupby('年份')
def f(df_3):
    data = OrderedDict()
    data['LP_max']  = df_3["lowest price "].max()
    data['LP_mean'] = df_3['lowest price '].mean()
    data['LP_0.75']  = df_3['lowest price '].quantile(q=0.75)
    return pd.Series(data)
year.apply(f).head()

# (4) 现在将表格行索引设为多级索引,外层为年份,内层为原表格第二至第五列的变量名,列索引为月份。
Month = df_3.iloc[0:12,1].to_list()

result = df_3.melt(id_vars=['年份','月份'],value_vars=['Total number of license issued','lowest price ','avg price','Total number of applicants']\
                    ,value_name='info')
#result.set_index().pivot_table
df_4 = result.pivot_table(index = ['年份','variable'],columns='月份',values='info',fill_value='-').reindex(columns = Month)
df_4.head()

df_3.head()
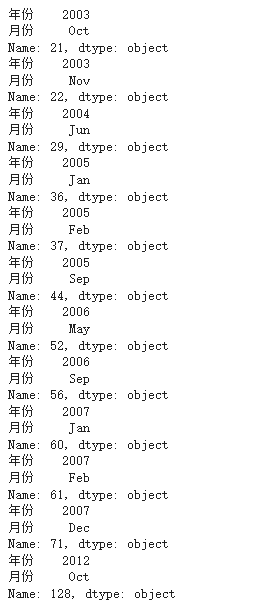
#(5) 一般而言某个月最低价与上月最低价的差额,会与该月均值与上月均值的差额具有相同的正负号,哪些拍卖时间不具有这个特点?
for index in df_3.index:
    try:
        signal = (df_3.loc[index,'lowest price '] - df_3.loc[index+1,'lowest price '])*\
                 (df_3.loc[index,'avg price'] - df_3.loc[index+1,'avg price'])
        if signal < 0:
            print(df_3.loc[index + 1,['年份','月份']])
    except:
        break
df_car.head()
# (6) 将某一个月牌照发行量与其前两个月发行量均值的差额定义为发行增益,最初的两个月用 0 填充,求发行增益极值出现的时间。
import sys
df_6 = df_car[['Date','Total number of license issued']]
gain = [0,0]
string = 'Total number of license issued'
for index in range(2, len(df_6)):
    gain.append(df_car.loc[index][string] - np.mean([df_car.loc[index-1][string], df_car.loc[index-2][string]]))
df_6['gain'] = gain
print('增益极大值出现在:', df_6[df_6['gain'] == df_6['gain'].max()]['Date'].values)
print('增益极小值出现在:', df_6[df_6['gain'] == df_6['gain'].min()]['Date'].values)

二、2007 年-2019 年俄罗斯机场货运航班运载量
问题
(1) 求每年货运航班总运量。
(2) 每年记录的机场都是相同的吗?
(3) 按年计算 2010 年-2015 年全年货运量记录为 0 的机场航班比例。
(4) 若某机场至少存在 5 年或以上满足所有月运量记录都为 0,则将其所有 年份的记录信息从表中删除,并返回处理后的表格
(5) 采用一种合理的方式将所有机场划分为东南西北四个分区,并给出 2017 年-2019 年货运总量最大的区域。
(6) 在统计学中常常用秩代表排名,现在规定某个机场某年某个月的秩为该 机场该月在当年所有月份中货运量的排名(例如 *** 机场 19 年 1 月运 量在整个 19 年 12 个月中排名第一,则秩为 1),那么判断某月运量情 况的相对大小的秩方法为将所有机场在该月的秩排名相加,并将这个量 定义为每一个月的秩综合指数,请根据上述定义计算 2016 年 12 个月 的秩综合指数。
df_els = pd.read_csv('2007年-2019年俄罗斯货运航班运载量.csv')
df_els.head()

# (1) 求每年货运航班总运量
print('各年货运总量航班:')
df_els.groupby('Year')['Whole year'].sum()

#(2) 每年记录的机场都是相同的吗?
print("每年纪录的机场如下")
print(df_els.groupby('Year')['Airport name'].count())
airplaneno = (df_els.groupby('Airport name')['Year'].count())
print("出现小于13次的机场有:{a}个,占机场总数比{b}" .format(a = airplaneno[airplaneno<13].count(),b = round(airplaneno[airplaneno<13].count()/airplaneno.count(),2)))

#(3) 按年计算 2010 年-2015 年全年货运量记录为 0 的机场航班比例
year = [2010,2011,2012,2013,2014,2015]
df3 = df_els[df_els['Year'].isin(year)]
for y in year:
    dd = df3[df3['Year']==y]
#     print(dd[dd['Whole year']==0].shape[0])
#     print(f"{y}-{dd[dd['Whole year']==0].shape[0]*100/dd.shape[0]:4.2f}%")
    print("在{a}年,全年货运量记录为0的机场航班比例为{b},货运数量为{c}"
          .format(a = y, b = f"{dd[dd['Whole year']==0].shape[0]*100/dd.shape[0]:4.2f}%",c = dd[dd['Whole year']==0].shape[0]))

#(4) 若某机场至少存在 5 年或以上满足所有月运量记录都为 0,则将其所有年份的记录信息从表中删除,并返回处理后的表格
remove = 0
df_4 = df_els.copy()
for name,group in df_4.groupby('Airport name'):
    zeroyear = group[group['Whole year']==0].shape[0]
    if zeroyear >= 5:
        #print(name,zeroyear)
        remove += zeroyear
        df_4 = df_4[df_4['Airport name']!=name]
df_4.describe()

#(5) 采用一种合理的方式将所有机场划分为东南西北四个分区,并给出 2017 年-2019 年货运总量最大的区域。
df_5 = df_4[df_4['Year']>2016].copy()
import re
#坐标拆分
df_5['lon'] = df_5['Airport coordinates'].apply(lambda x : float(re.findall(r'\d+.\d+',x)[0]))
df_5['lat'] = df_5['Airport coordinates'].apply(lambda x : float(re.findall(r'\d+.\d+',x)[1]))
df_5.head()
df_5.to_csv('第五题.csv')
分东-南-西-北
Elon = df_5['lon'].quantile(0.75)
Wlon = df_5['lon'].quantile(0.25)
def f2(lon,lat):#先按1:2:1分西;中;东部。中部再按1:1分南北
    if lon>Elon:
        pos = 'E'
    elif lon<Wlon:
        pos = 'W'
    else:
        pos = 'M'
    return pos
def f3(lon,lat):#先按1:2:1分西;中;东部。中部再按1:1分南北
    #print(Mlat)
    if lat> Mlat:
        pos = 'N'
    else:
        pos = 'S'
    return pos
df_5['region'] = df_5.apply(lambda x: f2(x['lon'],x['lat']),axis=1)#分完东-中-西
Mlat = df_5.groupby('region').get_group('M')['lat'].median()
df_5['region'] = df_5.apply(lambda x: f3(x['lon'],x['lat']) if x['region']=='M' else x['region'],axis=1)
print('按中位数划分四区,机场数量分布如下:')
display(df_5.groupby(['Year','region'])['Whole year'].count())
print(f"期间,运量最大区域为:{df_5.groupby('region')['Whole year'].sum().idxmax()}")

#另一种,NE NW SE SW
lonmed = df_5['lon'].median();latmed = df_5['lat'].median()
print(f'2017-2019机场分布经纬度中位数{lonmed},{latmed}')
def f(lon,lat):
    if lat>latmed:#纬度高
        string = 'N'
    else:
        string = 'S'
    if lon>lonmed:#经度大
        string +='E'
    else:
        string +='W'
    return string
df_5['region'] = df_5.apply(lambda x: f(x['lon'],x['lat']),axis=1)
print('按中位数划分四区,机场数量分布如下:')
display(df_5.groupby(['Year','region'])['Whole year'].count())
print(f"期间,运量最大区域为:{df_5.groupby('region')['Whole year'].sum().idxmax()}")

"""(6) 在统计学中常常用秩代表排名,现在规定某个机场某年某个月的秩为该机场该月在当年所有月份中货运量的排名
(例如 *** 机场 19 年 1 月运 量在整个 19 年 12 个月中排名第一,则秩为 1),
那么判断某月运量情况的相对大小的秩方法为将所有机场在该月的秩排名相加,
并将这个量定义为每一个月的秩综合指数,请根据上述定义计算 2016年12个月的秩综合指数。 """
df_6 = df_4.query('Year==2016').copy()
month = list(df_6.columns[2:14])
for i in month:
    df_6[i+'_r']=0
#print(df6.shape)
for index in df_6.index:
    mid = df_6.loc[index,month].sort_values(ascending = False)#排序
    rank = 1
    for ii in mid.index:#赋rank
        df_6.loc[index,ii+'_r']=rank
        rank+=1
print(df_6.iloc[:,-12:].sum())

三、新冠肺炎在美国的传播
问题
(1) 用corr()函数计算县(每行都是一个县)人口与表中最后一天记录日期死亡数的相关系数。
(2) 截止到4月1日,统计每个州零感染县的比例。
(3) 请找出最早出确证病例的三个县。
(4) 按州统计单日死亡增加数,并给出哪个州在哪一天确诊数增加最大(这 里指的是在所有州和所有天两个指标一起算,不是分别算)。
(5) 现需对每个州编制确证与死亡表,第一列为时间,并且起始时间为该州 开始出现死亡比例的那一天,第二列和第三列分别为确证数和死亡数,每个州需要保存为一个单独的 csv 文件,文件名为“州名.csv”。
(6) 现需对 4 月 1 日至 4 月 10 日编制新增确证数与新增死亡数表,第一列 为州名,第二列和第三列分别为新增确证数和新增死亡数,分别保存为十个单独的csv文件,文件名为“日期.csv”。
df_confirmed =pd.read_csv('美国确证数.csv')
df_death=pd.read_csv('美国死亡数.csv')
df_confirmed.info()
df_confirmed.head()

df_death.info()
df_death.head()

#(1) 用corr()函数计算县(每行都是一个县)人口与表中最后一天记录日期死亡数的相关系数。
df_death[['Population','2020/4/26']].corr()

#(2) 截止到 4 月 1 日,统计每个州零感染县的比例
df_confirmed_ratio=df_confirmed.loc[:,['Admin2','Province_State','2020/4/1']]
df_confirmed_ratio.head()

ratio_confirmed = (df_confirmed_ratio[df_confirmed_ratio['2020/4/1']==0].groupby('Province_State')['2020/4/1'].count()/
                   df_confirmed_ratio.groupby('Province_State')['2020/4/1'].count()).fillna(0)
result = pd.DataFrame({'ratio':ratio_confirmed})
result.head()

ratio_confirmed.head()

#(3) 请找出最早出确证病例的三个县。
df_3=df_confirmed.set_index('Admin2').loc[:,list(df_confirmed.columns)[11:107]]
df_3.head()

a=[]
b=[]
def fun(x):
    for i in x.index:
        if x[i]!=0:
            return i
for index,raw in df_3.iterrows():
    a.append(index)
    b.append(fun(raw))
result=pd.DataFrame({'data':b},index=a)['data'].sort_values()[:3]
result=pd.DataFrame(result)
result

#(4) 按州统计单日死亡增加数,并给出哪个州在哪一天确诊数增加最大(这里指的是在所有州和所有天两个指标一起算,不是分别算)。
df_4=df_death.groupby(by='Province_State')[list(df_death.columns)[12:108]].sum()
df_4.head()

df_list=list(df_4.columns)
for i in df_list:
    if df_list.index(i)==0:
        df_4[i+'inc']=df_4[i]
    else:
        df_4[i+'inc']=df_4[i]-df_4[df_list[df_list.index(i)-1]]
result_4 = df_4[list(df_4.columns)[len(df_list):]]
result_4.head()

for i in result_4.index:
     if result_4.loc[i,result_4.max().idxmax()]==result_4.max().max():
        print('{}州在{}这一天增长最多'.format(i,result_4.max().idxmax().replace('inc','')))
        break

"""(5)现需对每个州编制确证与死亡表,第一列为时间,并且起始时间为该州开始出现死亡比例的那一天,
第二列和第三列分别为确证数和死亡数,每个州需要保存为一个单独的csv文件,文件名为“州名.csv”。"""
df_5=df_death.groupby(by='Province_State')[list(df_death.columns)[12:108]].sum()
df_confirmed=df_confirmed.groupby(by='Province_State')[list(df_death.columns)[12:108]].sum()
df_5.head()

time_list=list(df_death.columns[12:108])
time_list_q=list(df_confirmed.columns)
def fun_1(idex):
    q=[]
    s=[]
    for i in time_list:
        if df_5.loc[idex][i]!=0:
            a=time_list.index(i)
            break
    q=[x for x in df_confirmed.loc[idex,time_list_q[a:]]]
    s=[x for x in df_5.loc[idex,time_list[a:]]]
    ch= idex + '.csv'
    result=pd.DataFrame({'确诊数':q,'死亡数':s},index=time_list[a:])
    result.to_csv(ch)
for i in df_5.index:
    fun_1(i)

"""6.现需对4月1日至4月10日编制新增确证数与新增死亡数表,第一列为州名,
第二列和第三列分别为新增确证数和新增死亡数,分别保存为十个单独的 csv 文件,文件名为“日期.csv”。"""
df_6=df_death.groupby(by='Province_State')[list(df_death.columns)[82:92]].sum()
df_confirmed=df_confirmed.groupby(by='Province_State')[list(df_death.columns)[82:92]].sum()
df_confirmed.head()

df_list = list(df_6.index)
df_list_confirmed = df_list
def fun_2(idx):
    a = []
    b = []
    a = [x for x in df_6[idx]]
    b = [x for x in df_confirmed[idx]]
    result = pd.DataFrame({'确诊数':b,'死亡数':a},index=df_list)
    ch = idx.replace('/','.')+'.csv'
    result.to_csv(ch)
for i in df_confirmed.columns:
    fun_2(i)


 426
426


 被折叠的 条评论
为什么被折叠?
被折叠的 条评论
为什么被折叠?
 到【灌水乐园】发言


