


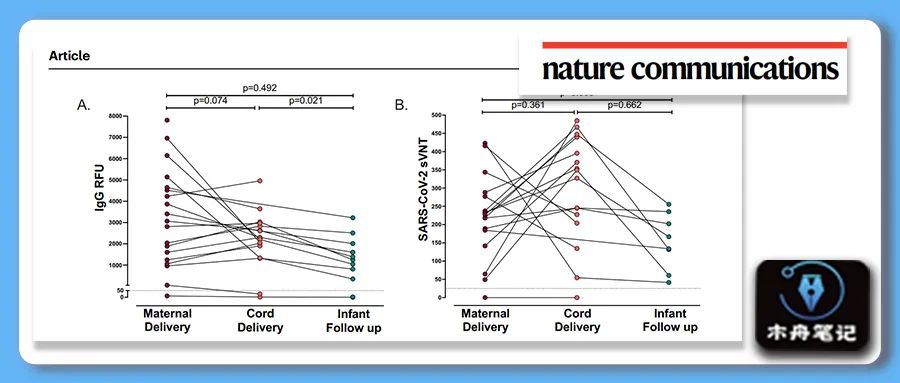
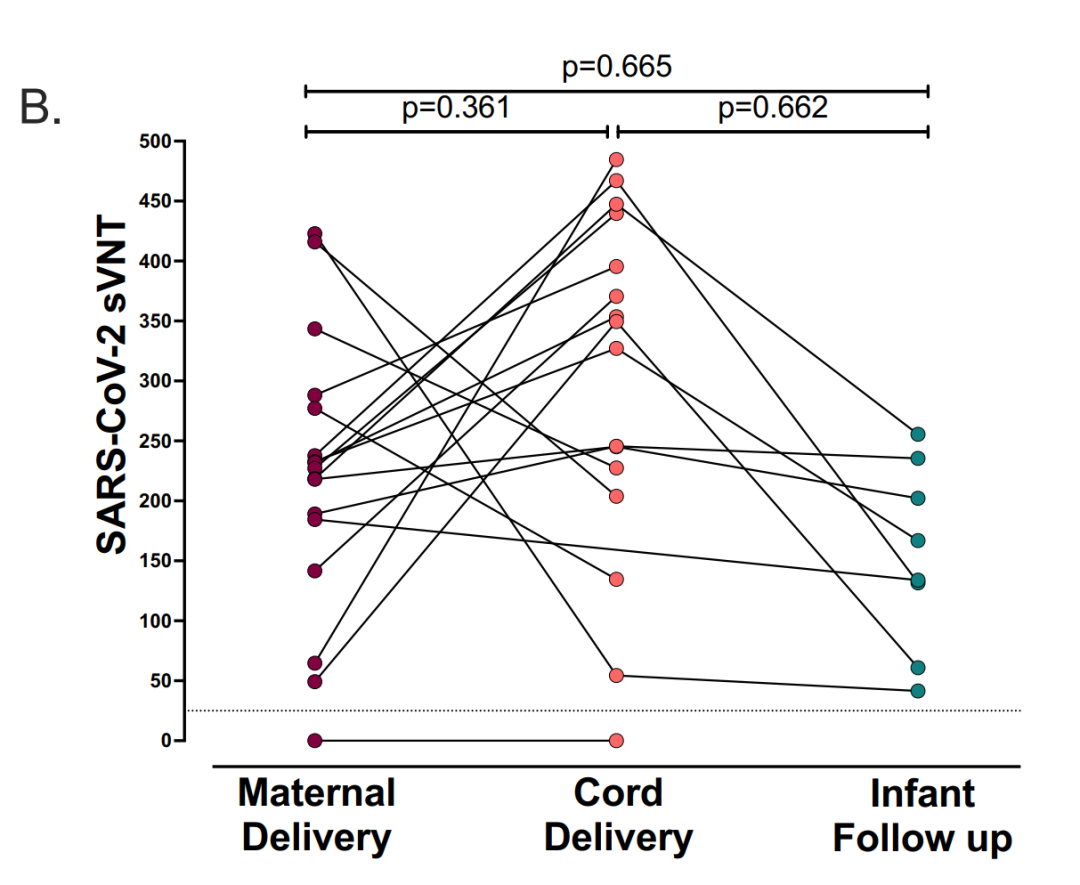
今天我们复现一幅2022年7月发表在nature communications上的配对连线散点图。
❝Title:Evaluation of transplacental transfer of mRNA vaccine products and functional antibodies during pregnancy and infancy
DOI:https://doi.org/10.1038/s41467-022-32188-1
❞
之前复现过的「散点图」:
本期图片
结果展示
❝纯R实现,放心食用。
❞

示例数据和代码领取
点赞、在看 本文,分享至朋友圈集赞25个并保留30分钟,截图发至微信mzbj0002领取。
「木舟笔记2022年度VIP可免费领取」。
木舟笔记2022年度VIP企划
「权益:」
「2022」年度木舟笔记所有推文示例数据及代码(「在VIP群里实时更新」)。
资源合集 木舟笔记「科研交流群」。
「半价」购买
跟着Cell学作图系列合集(免费教程+代码领取)|跟着Cell学作图系列合集。
「收费:」
「99¥/人」。可添加微信:mzbj0002 转账,或直接在文末打赏。

绘制
# 生成示例数据
dt = data.frame(sample = paste0('sample',1:30),
                A = runif(30,0,450),
                B = runif(30,100,500),
                C = runif(30,0,300))
head(dt)
# 长宽转换
library(tidyverse)
library(reshape2)
dt_long <- melt(dt,
                measure.vars = c("A","B",'C'),
                variable.name = "group",
                value.name = "value")
# 绘图
library(ggplot2)
library(ggthemes)
head(dt_long)
# 绘制散点图+配对连线
p1 <- ggplot(dt_long,aes(group, value, fill = group))+
  geom_line(aes(group = sample),
            size = 0.5)+#图层在下,就不会显示到圆心的连线
  geom_point(shape = 21,
             size = 3,
             stroke = 0.6,
             color = 'black')+
  scale_x_discrete(expand = c(-1.05, 0)) + # 坐标轴起始
  scale_fill_manual(values = c('#800040','#fc6666','#108080'))+
  geom_rangeframe() + # 坐标轴分离
  theme_tufte() +
  theme(legend.position = 'none',  # 标签字体等
        axis.text.y = element_text(size = 14,
                                   face = "bold"),
        axis.text.x = element_text(size =14,
                                   face = "bold"),
        axis.title.y = element_text(size = 15,
                                    color = "black",
                                    face = "bold")) +
  labs(x = ' ',
       y = 'Values')

p1

# 为了绘制原图的差异形式 手动计算p值
library(rstatix)
result = t_test(dt_long,value~group)
head(result)

# 添加显著性标记
p2 <- p1 +
  coord_cartesian(clip = 'off',ylim = c(0,500))+
  theme(plot.margin = margin(1,0,0,0.5,'cm'))+
  annotate('segment',x=1,xend=1.99,y=510,yend=510,color='black',cex=.6)+
  annotate('segment',x=1,xend=1,y=505,yend=515,color='black',cex=.6)+
  annotate('segment',x=1.99,xend=1.99,y=505,yend=515,color='black',cex=.6)+
  annotate('segment',x=2.01,xend=3,y=510,yend=510,color='black',cex=.6)+
  annotate('segment',x=2.01,xend=2.01,y=505,yend=515,color='black',cex=.6)+
  annotate('segment',x=3,xend=3,y=505,yend=515,color='black',cex=.6)+
  annotate('segment',x=1,xend=3,y=530,yend=530,color='black',cex=.6)+
  annotate('segment',x=1,xend=1,y=525,yend=535,color='black',cex=.6)+
  annotate('segment',x=3,xend=3,y=525,yend=535,color='black',cex=.6)+
  annotate("text", x = 1.5, y = 520, label ="p = 0.080",size = 6)+
  annotate("text", x = 2.5, y = 520, label ="p = 0.129",size = 6)+
  annotate("text", x = 2, y = 540, label ="p = 0.0004",size = 6)
p2
ggsave('paired_scatter.pdf',p2,width = 8,height = 7)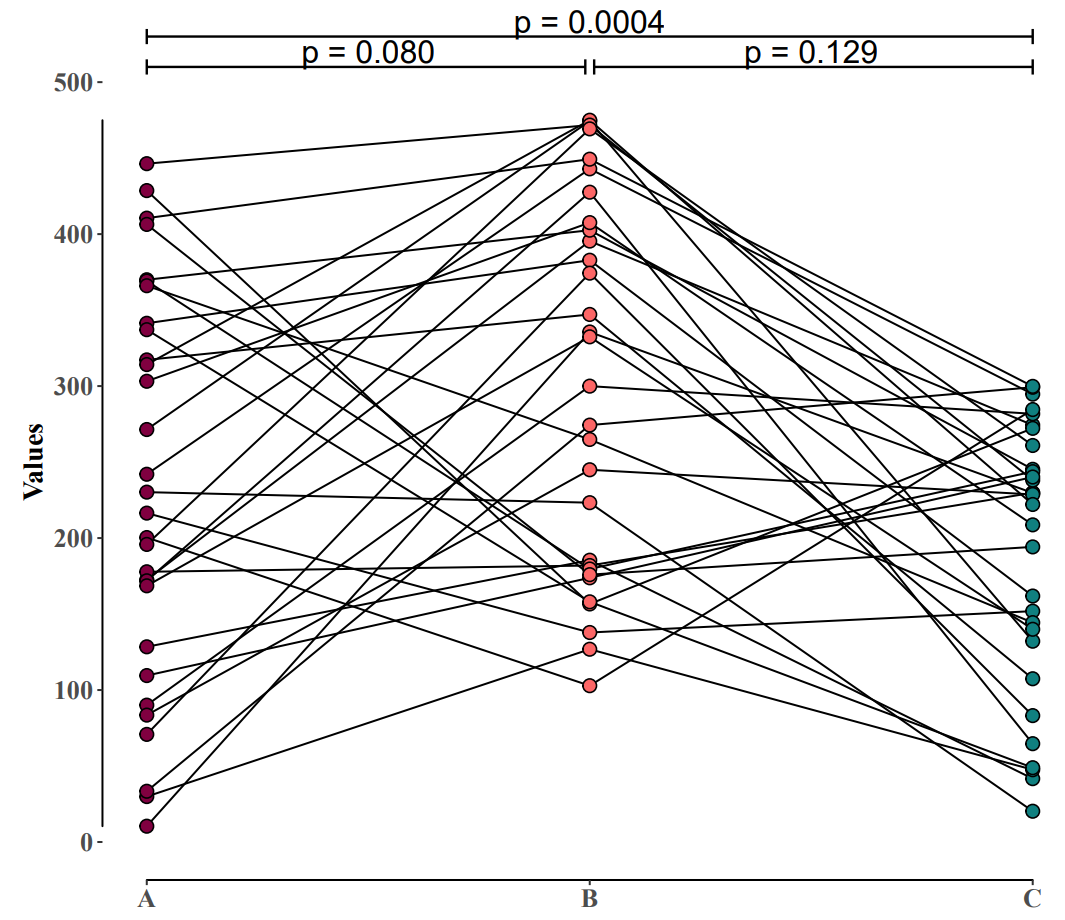
往期内容


 175
175


 被折叠的 条评论
为什么被折叠?
被折叠的 条评论
为什么被折叠?
 到【灌水乐园】发言


