


流量感知插件NetworkTraffic Plugin
参考博客
K8s的自定义调度方法有两种,一种是extender(调度器扩展程序),一种是scheduler-plugin(调度插件),前者是对调度器的完全侵入修改,后者只是部分侵入修改。本文使用scheduler-plugin自定义流量感知插件。
需要准备两样东西:
- scheduler-plugin代码
- k8s集群
一、扩展点机制
二、scheduler-plugin项目
首先下载该项目到本地,网址是https://github.com/kubernetes-sigs/scheduler-plugins
下载完后根据k8s集群的版本切换到不同版本的分支(本文的k8s版本是1.22.7):
git checkout release-1.22
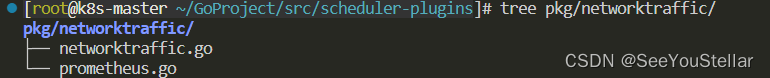
调度器主要的代码放在pkg文件夹下,里面有很多预先提供的调度器样例。在该文件夹下新建一个networktraffic文件夹,里面将要存放调度器逻辑代码。
前面提到了每个插件都可以实现framework中的多个扩展点。本插件实现了scoreplugin扩展点。
2.1 networktraffic.go
networktraffic代码通过NetworkTraffic类实现了scoreplugin扩展点(接口)。接口定义如下:
type ScorePlugin interface {
	Plugin
	// Score is called on each filtered node. It must return success and an integer
	// indicating the rank of the node. All scoring plugins must return success or
	// the pod will be rejected.
	Score(ctx context.Context, state *CycleState, p *v1.Pod, nodeName string) (int64, *Status)

	// ScoreExtensions returns a ScoreExtensions interface if it implements one, or nil if does not.
	ScoreExtensions() ScoreExtensions
}
networktraffic代码如下:
package networktraffic

import (
	"context"
	"fmt"
	"time"

	v1 "k8s.io/api/core/v1"
	"k8s.io/apimachinery/pkg/runtime"
	"k8s.io/klog/v2"
	"k8s.io/kubernetes/pkg/scheduler/framework"
	"sigs.k8s.io/scheduler-plugins/pkg/apis/config"
)

// NetworkTraffic is a score plugin that favors nodes based on their
// network traffic amount. Nodes with less traffic are favored.
// Implements framework.ScorePlugin
type NetworkTraffic struct {
	handle     framework.Handle
	prometheus *PrometheusHandle
}

// Name is the name of the plugin used in the Registry and configurations.
const Name = "NetworkTraffic"

var _ = framework.ScorePlugin(&NetworkTraffic{})

// New initializes a new plugin and returns it.
func New(obj runtime.Object, h framework.Handle) (framework.Plugin, error) {
	args, ok := obj.(*config.NetworkTrafficArgs)
	if !ok {
		return nil, fmt.Errorf("[NetworkTraffic] want args to be of type NetworkTrafficArgs, got %T", obj)
	}

	klog.Infof("[NetworkTraffic] args received. NetworkInterface: %s; TimeRangeInMinutes: %d, Address: %s", args.NetworkInterface, args.TimeRangeInSeconds, args.Address)

	return &NetworkTraffic{
		handle:     h,
		prometheus: NewPrometheus(args.Address, args.NetworkInterface, time.Minute*time.Duration(args.TimeRangeInSeconds)),
	}, nil
}

// Name returns name of the plugin. It is used in logs, etc.
func (n *NetworkTraffic) Name() string {
	return Name
}

func (n *NetworkTraffic) Score(ctx context.Context, state *framework.CycleState, p *v1.Pod, nodeName string) (int64, *framework.Status) {
	// nodeInfo, err := n.handle.SnapshotSharedLister().NodeInfos().Get(nodeName)
	nodeBandwidth, err := n.prometheus.GetNodeBandwidthMeasure(nodeName, n.prometheus.networkInterface)
	if err != nil {
		return 0, framework.NewStatus(framework.Error, fmt.Sprintf("error getting node bandwidth measure: %s", err))
	}

	klog.Infof("[NetworkTraffic] node '%s' bandwidth: %s", nodeName, nodeBandwidth.Value)
	return int64(nodeBandwidth.Value), nil
}

func (n *NetworkTraffic) ScoreExtensions() framework.ScoreExtensions {
	return n
}

func (n *NetworkTraffic) NormalizeScore(ctx context.Context, state *framework.CycleState, pod *v1.Pod, scores framework.NodeScoreList) *framework.Status {
	var higherScore int64
	for _, node := range scores {
		if higherScore < node.Score {
			higherScore = node.Score
		}
	}

	for i, node := range scores {
		scores[i].Score = framework.MaxNodeScore - (node.Score * framework.MaxNodeScore / higherScore)
	}

	klog.Infof("[NetworkTraffic] Nodes final score: %v", scores)
	return nil
}
2.2 prometheus.go
主要是与prometheus-server的交互,相当于prometheus的客户端。可以通过编辑查询字符串的方式来访问prometheus-server,返回结果传递给networktraffic,用以打分。
这里的查询语句是过去的连续时间段内某个节点所有网卡的发送与接收字节数和。
sum_over_time(node_network_receive_bytes_total{instance=ip地址, device=网卡名}[%s])+sum_over_time(node_network_transmit_bytes_total{instance=ip地址, device=网卡名}[时间段])
package networktraffic

import (
	"context"
	"fmt"
	"time"

	"github.com/prometheus/client_golang/api"
	v1 "github.com/prometheus/client_golang/api/prometheus/v1"
	"github.com/prometheus/common/model"
	"k8s.io/klog/v2"
)

const (
	// nodeMeasureQueryTemplate is the template string to get the query for the node used bandwidth
	// nodeMeasureQueryTemplate = "sum_over_time(node_network_receive_bytes_total{instance=\"%s\"}[%s])"
	nodeMeasureQueryTemplate = "sum_over_time(node_network_receive_bytes_total{instance=\"%s\", device=\"%s\"}[%s])+sum_over_time(node_network_transmit_bytes_total{instance=\"%s\", device=\"%s\"}[%s])"
)

// Handles the interaction of the networkplugin with Prometheus
type PrometheusHandle struct {
	networkInterface string
	timeRange        time.Duration
	address          string
	api              v1.API
}

func NewPrometheus(address, networkInterface string, timeRange time.Duration) *PrometheusHandle {
	client, err := api.NewClient(api.Config{
		Address: address,
	})
	if err != nil {
		klog.Fatalf("[NetworkTraffic] Error creating prometheus client: %s", err.Error())
	}

	return &PrometheusHandle{
		networkInterface: networkInterface,
		timeRange:        timeRange,
		address:          address,
		api:              v1.NewAPI(client),
	}
}

func (p *PrometheusHandle) GetNodeBandwidthMeasure(node string, networkInterface string) (*model.Sample, error) {
	fmt.Printf("[NetworkTraffic] GetNodeBandwidthMeasure: %s\n", node)
	var nodeip string
	if node == "k8s-node1" {
		nodeip = "10.10.10.171"
	} else if node == "k8s-node2" {
		nodeip = "10.10.10.177"
	} else {
		nodeip = "10.10.10.172"
	}
	nodeip += ":9100"
	query := getNodeBandwidthQuery(nodeip, networkInterface, p.timeRange)
	res, err := p.query(query)
	if err != nil {
		return nil, fmt.Errorf("[NetworkTraffic] Error querying prometheus: %w", err)
	}

	nodeMeasure := res.(model.Vector)
	if len(nodeMeasure) != 1 {
		return nil, fmt.Errorf("[NetworkTraffic] Invalid response, expected 1 value, got %d", len(nodeMeasure))
	}

	return nodeMeasure[0], nil
}

func getNodeBandwidthQuery(nodeip string, networkInterface string, timeRange time.Duration) string {
	return fmt.Sprintf(nodeMeasureQueryTemplate, nodeip, networkInterface, timeRange, nodeip, networkInterface, timeRange)
}

func (p *PrometheusHandle) query(query string) (model.Value, error) {
	results, warnings, err := p.api.Query(context.Background(), query, time.Now())

	if len(warnings) > 0 {
		klog.Warningf("[NetworkTraffic] Warnings: %v\n", warnings)
	}

	return results, err
}
三、本地测试
主要用到两个个文件:自定义调度器配置文件lxyscore-config.yaml,调度器身份认证文件scheduler-conf。并且在本地测试的过程中需要把manifest/kube-scheduler.yaml文件(默认调度器配置文件)移除manifest文件夹。
manifest文件夹下的文件是各k8s组件的配置,k8s会不断kubectl apply,所以必须移掉manifest/kube-scheduler.yaml。
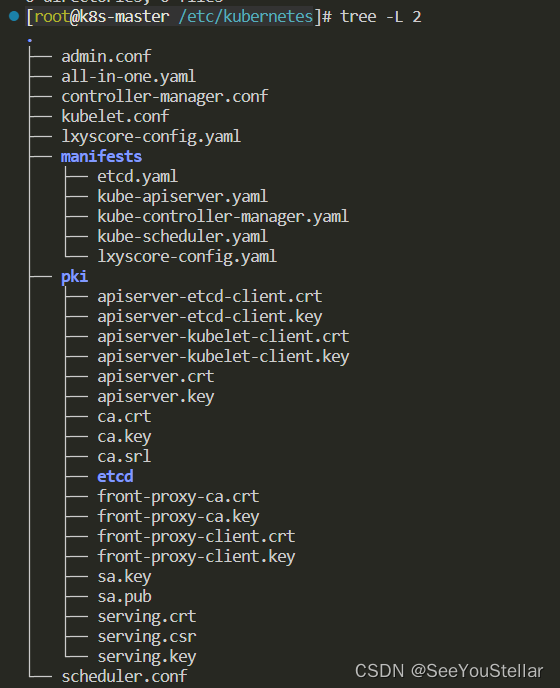
调度器配置lxyscore-config.yaml:
apiVersion: kubescheduler.config.k8s.io/v1beta1
kind: KubeSchedulerConfiguration
clientConnection:
  kubeconfig: "/etc/kubernetes/scheduler.conf"
profiles:
- schedulerName: default-scheduler
  plugins:
    score:
      enabled:
      - name: NetworkTraffic
      disabled:
      - name: "*"
  pluginConfig:
  - name: NetworkTraffic
    args:
      prometheusAddress: "http://10.2.0.84:30090/"
      networkInterface: "tunl0"
      timeRangeInSeconds: 30
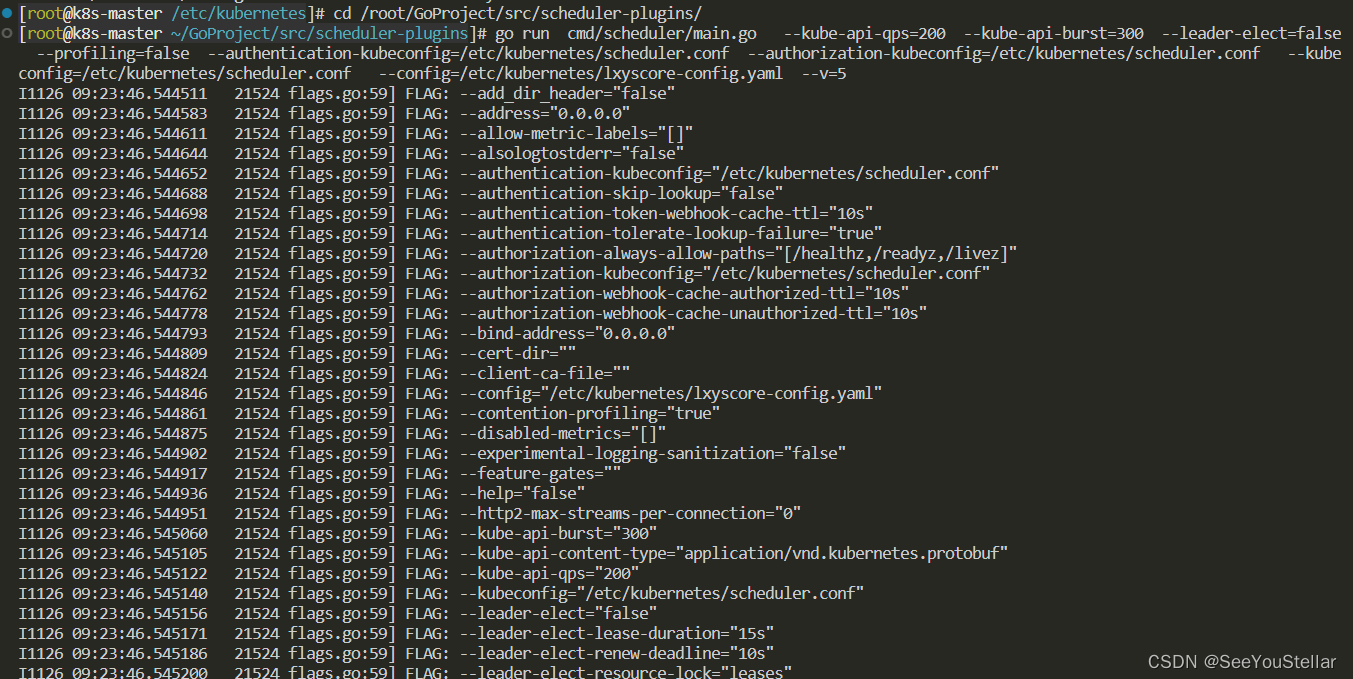
运行下述命令,进行本地测试:
go run cmd/scheduler/main.go --kube-api-qps=200 --kube-api-burst=300 --leader-elect=false --profiling=false --authentication-kubeconfig=/etc/kubernetes/scheduler.conf --authorization-kubeconfig=/etc/kubernetes/scheduler.conf --kubeconfig=/etc/kubernetes/scheduler.conf --config=/etc/kubernetes/lxyscore-config.yaml --v=5
调度器启动首先会进行一系列参数的初始化:
运行deployment.yaml
apiVersion: v1
kind: Namespace
metadata:
  name: kubia
---
apiVersion: apps/v1
kind: Deployment
metadata:
  name: kubia-deployment
  namespace: kubia
spec:
  replicas: 5
  selector:
    matchLabels:
      app: kubia
  template:
    metadata:
      name: kubia
      labels:
        app: kubia
    spec:
      containers:
      - image: luksa/kubia:v1
        name: nodejs
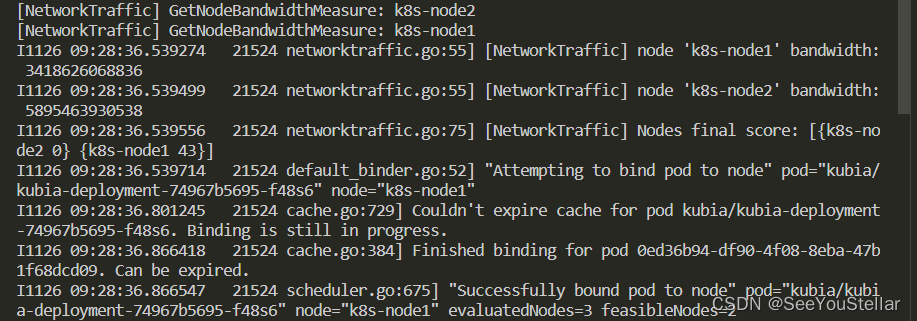
查看调度器输出:某一个pod的调度
四、scheduler-plugin编译运行
这部分镜像的编译一直有一点问题,之后有空再试试。


 758
758


 被折叠的 条评论
为什么被折叠?
被折叠的 条评论
为什么被折叠?
 到【灌水乐园】发言


