


-
结果展示
-
主要代码
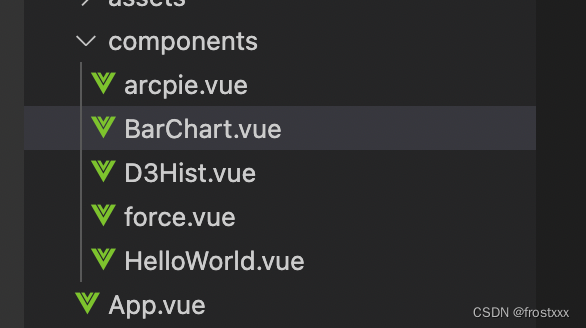
主要components有以下部分,arcpies是饼图,barchart是直方图,force是力导图。通过app.vue整合。
Arcpie.vue
该部分直接移植了可视化课上d3的代码,内容上与d3部分保持一致。通过mouseover和mouseout实现交互。
<template>
    <h2><a href="https://d3js.org" target="_blank" >D3饼图@VUE3</a></h2>
    <div id="bar-chart-container"></div>
</template>
<script>
import * as d3 from 'd3'

    export default {
        mounted() {
            const width=300;
            const height=300;
            function getColor(i) {
		var palette = [
				'#688db9', '#515696', '#9bbcab', '#d6cea9', '#a74a90',
				'#864d93', '#f1a641', '#f38936', '#ed7975', '#f26862']
		return palette[i%palette.length];}
        var dataList = [30,20,10,20,30,40,15,20,40,10];
        var piedata = d3.pie()(dataList);

        var mapPadding = 20
        var svgMap = d3.select("div")
                       .append('svg')
                       .attr("width", width)
                       .attr("height", height)
                       .style("margin", "10px")
        //定义弧形生成器
        var innerRadius = 50;
        var outerRadius = width / 2 - mapPadding;
        var arc_generator = d3.arc()
                              .innerRadius(innerRadius)
                              .outerRadius(outerRadius);


        var groups = svgMap.selectAll("g")
                           .data(piedata)
                           .enter()
                           .append("g")
                           .attr("transform", "translate(" + (width / 2) + "," + (height / 2) + ")")

        groups.append("path")
         	  .attr("fill",function(d,i){
			  		return getColor(i);})
              .attr("d", function (d) {
                    return arc_generator(d); //使用弧生成器获取路径
                  })
              .on("mouseover",function(d,i){
                      d3.select(this)
                        .transition()
                        .duration(300)
                        .attr("fill","yellow");
                  })
              .on("mouseout",function(d,i){
                      d3.select(this)
                        .transition()
                        .duration(300)
                        .attr("fill","grey");
                })

        //添加文字
        groups.append("text")
              .attr("transform", function (d) {//位置设在中心处
                    return "translate(" + arc_generator.centroid(d) + ")";
                })
              .attr("text-anchor", "middle")
              .text(function (d) {
                    return d.data;
                })
              .style("fill","black")
              .style("font-size","20px")
              .style('font-family', 'Arial')
        },
    }
</script>
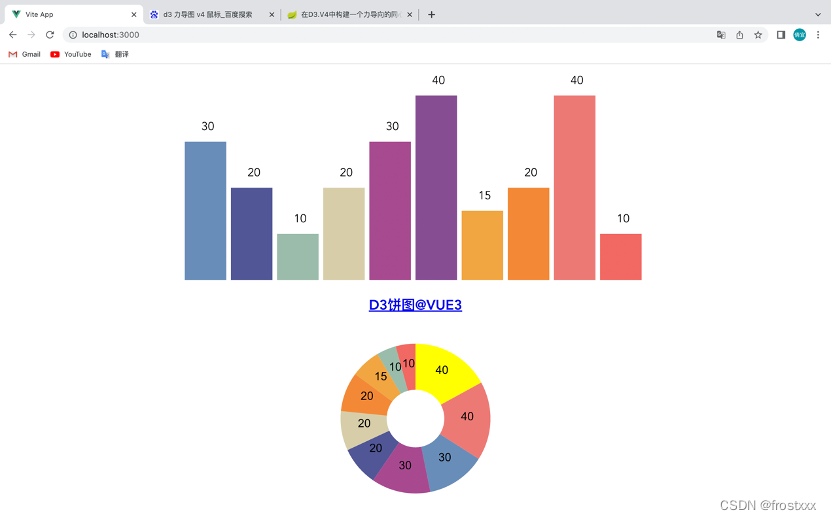
Barchart.vue
该部分是直方图的代码,在老师给的vue3+d3基础上进行了部分修改。
<template>
    <h2><a href="https://d3js.org" target="_blank" >D3直方图@VUE3</a></h2>
    <div id="bar-chart-container"></div>
</template>

<script>
import { defineComponent } from 'vue';
//import axios from "axios";
import * as d3 from "d3";

var data=new Array(10);
var data = [30,20,10,20,30,40,15,20,40,10];

export default defineComponent({
    mounted() {
        this.drawBarChart(data);
    },
    methods:{
        drawBarChart(data){
            const width=800;
            const height=400;
            var svg=d3.select("#bar-chart-container")
                      .append("svg")
                      .attr("width",width)
                      .attr("height",height);


            svg.selectAll("rect")
               .data(data)
               .enter()
               .append("rect")
               .attr("fill",function(d,i){
			  		return getColor(i);
			  	})

               .on("mouseover",function(d,i){
                      d3.select(this)
                        .transition()
                        .duration(300)
                        .attr("fill","yellow");
                })
                .on("mouseout",function(d,i){
                      d3.select(this)
                        .transition()
                        .duration(300)
                        .attr("fill","grey");
                })
               .attr("x",function(d,i){
                   return width*i/10;
               })
               .attr("y",d=>(height-8*d))
               .attr("height",function(d)
               {
                   return 100*d;
               })
               .attr("width",width*0.9/10);


			svg.selectAll("text")
               .data(data)
               .enter()
               .append("text")
			   .attr("dy", "-1em")
               .attr("x",function(d,i){
                   return width*i/10+width/20;
               })
               .attr("y",d=>(height-8*d))
			   .attr("text-anchor", "middle")
			   .attr("font-size", "20px")
			   .attr("fill", "Black")
			   .text(function(d) {
						return d;
					});


        function getColor(i) {
		var palette = [
				'#688db9', '#515696', '#9bbcab', '#d6cea9', '#a74a90',
				'#864d93', '#f1a641', '#f38936', '#ed7975', '#f26862',
				]
		return palette[i%palette.length];}
        }
    }
})
</script>
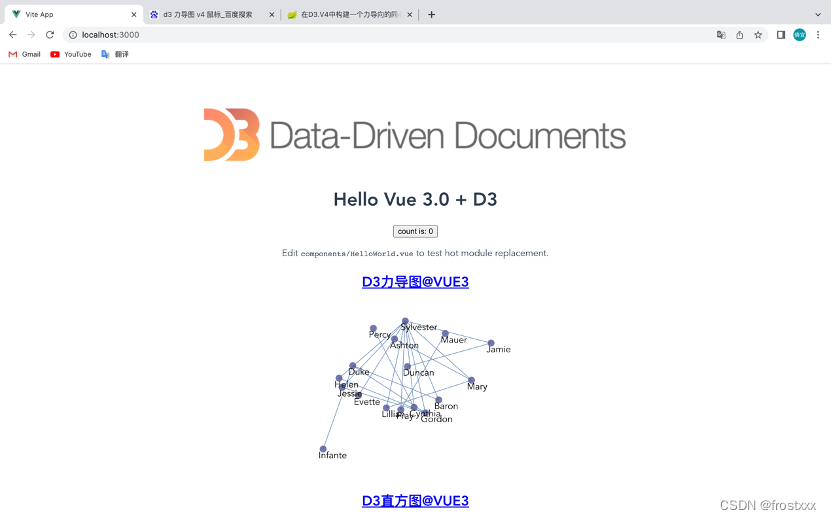
force.vue
该部分数据集来源于网络,版本是v4,参考了网络资料。
<template>
  <h2><a href="https://d3js.org" target="_blank" >D3力导图@VUE3</a></h2>
  <div>
    <svg width="960" height="300"></svg>
  </div>
</template>
<script>
import * as d3 from 'd3'
export default {
  data () {
    return {
    }
  },
  mounted ()
  {
		var svg = d3.select('svg')
		var width = svg.attr('width')
		var height = svg.attr('height')
	    var padding = {
        left: 30,
        right: 30,
        top: 20,
        bottom: 20
        }

		var nodesData = [
		{ 'name': 'Lillian', 'sex': 'F' ,index:'0'},
		{ 'name': 'Gordon', 'sex': 'M' ,index:'1'},
		{ 'name': 'Sylvester', 'sex': 'M' ,index:'2'},
		{ 'name': 'Mary', 'sex': 'F' ,index:'3'},
		{ 'name': 'Helen', 'sex': 'F' ,index:'4'},
		{ 'name': 'Jamie', 'sex': 'M' ,index:'5'},
		{ 'name': 'Jessie', 'sex': 'F' ,index:'6'},
		{ 'name': 'Ashton', 'sex': 'M' ,index:'7'},
		{ 'name': 'Duncan', 'sex': 'M' ,index:'8'},
		{ 'name': 'Evette', 'sex': 'F' ,index:'9'},
		{ 'name': 'Mauer', 'sex': 'M' ,index:'10'},
		{ 'name': 'Fray', 'sex': 'F' ,index:'11'},
		{ 'name': 'Duke', 'sex': 'M' ,index:'12'},
		{ 'name': 'Baron', 'sex': 'M' ,index:'13'},
		{ 'name': 'Infante', 'sex': 'M',index:'14' },
		{ 'name': 'Percy', 'sex': 'M' ,index:'15'},
		{ 'name': 'Cynthia', 'sex': 'F',index:'16' }
		]

		var linksData = [
		{ 'source': 'Sylvester', 'target': 'Gordon', 'type': 'A' },
		{ 'source': 'Sylvester', 'target': 'Lillian', 'type': 'A' },
		{ 'source': 'Sylvester', 'target': 'Mary', 'type': 'A' },
		{ 'source': 'Sylvester', 'target': 'Jamie', 'type': 'A' },
		{ 'source': 'Sylvester', 'target': 'Jessie', 'type': 'A' },
		{ 'source': 'Sylvester', 'target': 'Helen', 'type': 'A' },
		{ 'source': 'Helen', 'target': 'Gordon', 'type': 'A' },
		{ 'source': 'Mary', 'target': 'Lillian', 'type': 'A' },
		{ 'source': 'Ashton', 'target': 'Mary', 'type': 'A' },
		{ 'source': 'Duncan', 'target': 'Jamie', 'type': 'A' },
		{ 'source': 'Gordon', 'target': 'Jessie', 'type': 'A' },
		{ 'source': 'Sylvester', 'target': 'Fray', 'type': 'E' },
		{ 'source': 'Fray', 'target': 'Mauer', 'type': 'A' },
		{ 'source': 'Percy', 'target': 'Cynthia', 'type': 'A' },
		{ 'source': 'Infante', 'target': 'Duke', 'type': 'A' },
		{ 'source': 'Duke', 'target': 'Gordon', 'type': 'A' },
		{ 'source': 'Baron', 'target': 'Duke', 'type': 'A' },
		{ 'source': 'Baron', 'target': 'Sylvester', 'type': 'E' },
		{ 'source': 'Evette', 'target': 'Sylvester', 'type': 'E' },
		{ 'source': 'Cynthia', 'target': 'Sylvester', 'type': 'E' }
		]

		var force=d3.forceSimulation()
					.nodes(nodesData)
	             	.force('charge', d3.forceManyBody())
					.force('center', d3.forceCenter((width - padding.left - padding.right) / 2, (height - padding.top - padding.bottom) / 2))

	var linkForce = d3.forceLink(linksData)
		              .id((d) => { return d.name }).distance(150)
	force.force('links', linkForce)


	var link = svg.append('g')
			  	  .attr('class', 'links')
				  .selectAll('.line')
				  .data(linksData)
				  .enter()
				  .append('line')
				  .attr('stroke-width', 1)
				  .style('stroke', "#688db9")

	var node = svg.append('g')
				  .attr('class', 'nodes')
			      .selectAll('.node')
	    		  .data(nodesData)
				  .enter()
				  .append('circle')
				  .attr('r', 6)
				  .attr('fill', "#515696")
				  .style('opacity',0.8)

	var text = svg.append('g')
				  .attr('class', 'texts')
			      .selectAll('.node')
	    		  .data(nodesData)
				  .enter()
				  .append('text')
				  .attr('dx','-0.5em')
				  .attr('dy','1em')
				  .text(function(d){return d.name;})


	force.on('tick', tickAction)

	function tickAction () {
		node
			.attr('cx', function(d){ return d.x })
			.attr('cy', function(d){ return d.y })
		text
			.attr('x', function(d){ return d.x })
			.attr('y', function(d){ return d.y })

		link
			.attr('x1', function(d){ return d.source.x })
			.attr('y1', function(d){ return d.source.y })
			.attr('x2', function(d){ return d.target.x })
			.attr('y2', function(d){ return d.target.y })
		}
  }
}
</script>
D3hist.vue
<template>
  <div class="hello">
    <h1>{{ msg }}</h1>
  </div>
</template>

<script>
    import axios from "axios";
    export default{
        //挂载后执行
        mounted(){
            axios.get("./alphabet.json").then(res => {
                console.log(res.data);
            });
        },
    };
</script>


<!-- Add "scoped" attribute to limit CSS to this component only -->
<style scoped>
h3 {
  margin: 40px 0 0;
}
ul {
  list-style-type: none;
  padding: 0;
}
li {
  display: inline-block;
  margin: 0 10px;
}
a {
  color: #42b983;
}
</style>
App.vue
<template>
  <img alt="Vue logo" src="./assets/logo.png" />
  <HelloWorld msg="Hello Vue 3.0 + D3" />
  <HelloD3 msg="D3.JS@Vue3"/>
  <pic msg="D3.JS@Vue3"/>
  <BarChart />
  <Arcpie msg="D3.JS@Vue3"/>
</template>

<script>
import HelloWorld from './components/HelloWorld.vue'
import BarChart from './components/BarChart.vue';
import HelloD3 from './components/D3Hist.vue';
import pic from './components/force.vue';
import Arcpie from './components/arcpie.vue';

export default {
  name: 'App',
  components: {
    HelloWorld,
    BarChart,
    HelloD3,
    pic,
    Arcpie
}
}
</script>
-
反思总结
首次接触vue和vscode,在调试和理解代码框架上花费了较多的时间。在实际操作过程中,依旧有很多报错问题没有得到彻底的解决,比如力导图的拖拽交互。最后在结果展示的时候回避掉了。希望在以后的学习中能够进步,解决这些问题。


 1779
1779


 被折叠的 条评论
为什么被折叠?
被折叠的 条评论
为什么被折叠?
 到【灌水乐园】发言


