


十一,叠加水平柱状图
准备
①users['Total']=users['Oct']+users['Nov']+users['Dec'] #加和,Total=Oct+Nov+Dec
②barh #横向柱状图
③stacked=True #stacked"(堆叠,即不同数据纵向堆在一起)
④plt.tight_layout() #显示完整
2.代码
import pandas as pd
import matplotlib.pyplot as plt

users = pd.read_excel('文件位置/11.xlsx')
users['Total']=users['Oct']+users['Nov']+users['Dec']
users.sort_values(by='Total',inplace=True,ascending=True)
print(users)

users.plot.barh(x='Name', y=['Oct', 'Nov', 'Dec'],stacked=True,title='User Behavior')
plt.tight_layout()
plt.show()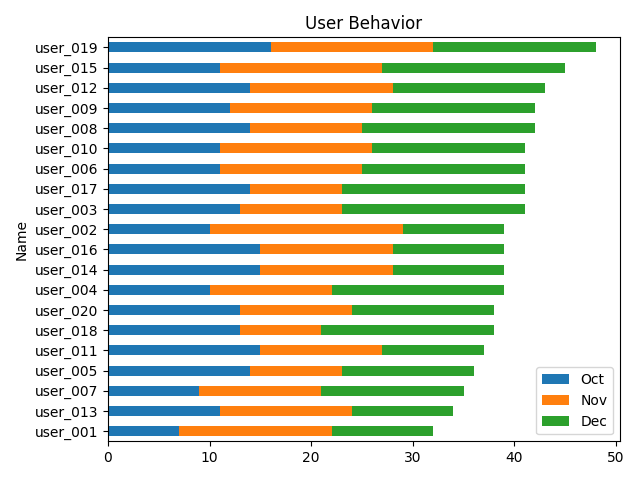
十二,饼图
准备
①index_col 默认值(index_col = None)——重新设置一列成为index值
②counterclock=False #顺时针
③ylabel #y轴的标题
2.代码
import pandas as pd
import matplotlib.pyplot as plt
students=pd.read_excel('文件位置12.xlsx',index_col='From')

print(students)

students['2017'].plot.pie(fontsize=8,counterclock=False)
plt.title('Source of International Students',fontsize=18,fontweight='bold')
plt.ylabel('2017',fontsize=12,fontweight='bold')
plt.show()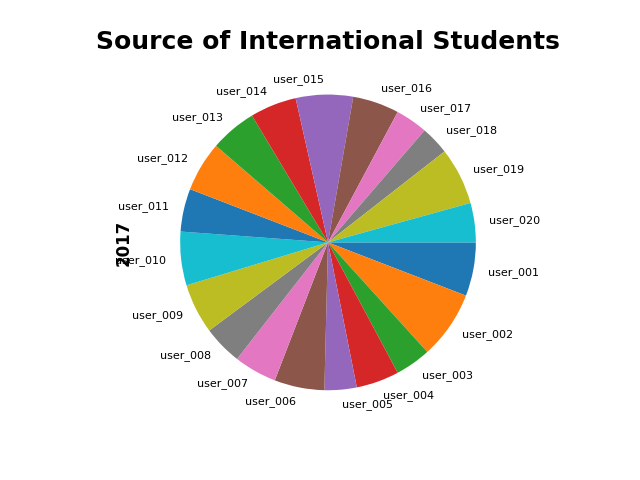
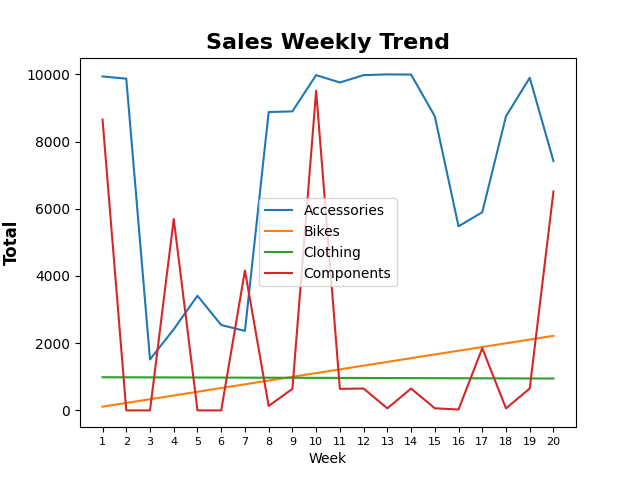
十三,折线趋势图,叠加区域图
准备
①y=['Accessories','Bikes', 'Clothing', 'Components'] #折线图的数值
②plt.xticks(weeks.index,fontsize=8) #xt = xticks 以向量形式返回当前 x 轴刻度值。
2.代码
import pandas as pd
import matplotlib.pyplot as plt
weeks=pd.read_excel('文件位置/13.xlsx',index_col='Week')
print(weeks)

print(weeks.columns)
weeks.plot(y=['Accessories','Bikes', 'Clothing', 'Components'])
# weeks.plot.bar(y=['Accessories','Bikes', 'Clothing', 'Components'],stacked=True)
plt.title('Sales Weekly Trend',fontsize=16,fontweight='bold')
plt.ylabel('Total',fontsize=12,fontweight='bold')
plt.xticks(weeks.index,fontsize=8)
plt.show()
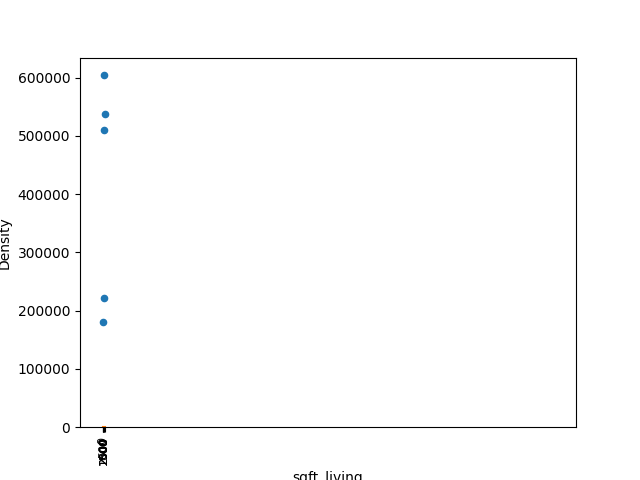
十四,散点图,直方图(代码同十五)
准备
①pd.options.display.max_columns=777 #显示最大列数
②scatter #scatter(x,y) 在向量 x 和 y 指定的位置创建一个包含圆形的散点图
③print(homes.corr()) #两列两列之间的相关性
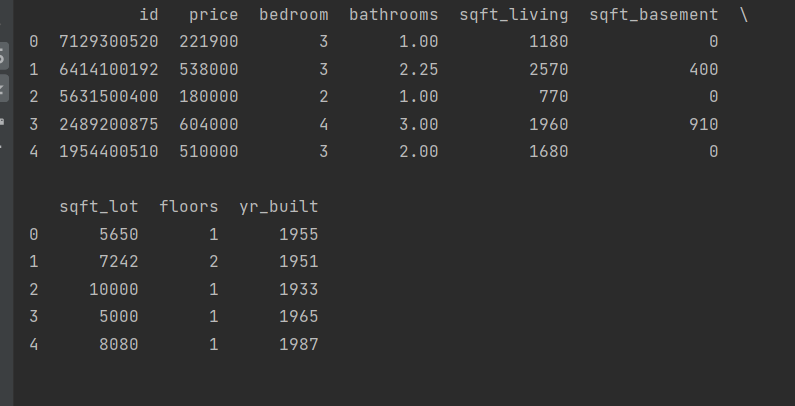
2.代码
import pandas as pd
import matplotlib.pyplot as plt
pd.options.display.max_columns=777
homes=pd.read_excel('文件位置/14.xlsx')
print(homes)

homes.plot.scatter(x='sqft_living',y='price')
homes.price.plot.hist(bins=100)
plt.xticks(range(0,max(homes.price),100000),fontsize=8,rotation=90)
homes.sqft_living.plot.kde()
plt.xticks(range(0,max(homes.sqft_living),500),fontsize=8,rotation=90)
plt.show()

print(homes.corr()) #两列两列之间的相关性
十五,密度图,数据相关图(代码同十四)
准备(同十四)
2.代码
import pandas as pd
import matplotlib.pyplot as plt
pd.options.display.max_columns=777
homes=pd.read_excel('文件位置/14.xlsx')
print(homes)

homes.plot.scatter(x='sqft_living',y='price')
homes.price.plot.hist(bins=100)
plt.xticks(range(0,max(homes.price),100000),fontsize=8,rotation=90)
homes.sqft_living.plot.kde()
plt.xticks(range(0,max(homes.sqft_living),500),fontsize=8,rotation=90)
plt.show()

print(homes.corr()) #两列两列之间的相关性
十六,多表联合
准备
①on #指定ID作为join,把merge换成join的话,join可以自己拿index作为索引,就不用on
②type() 返回参数的数据类型
dtype 返回数组中元素的数据类型
astype() 对数据类型进行转换
2.代码
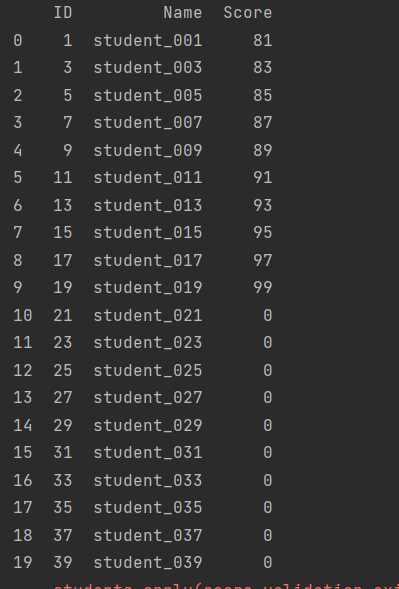
import pandas as pd

students = pd.read_excel('文件位置/1601.xlsx', sheet_name='Students')
scores = pd.read_excel('文件位置/1601.xlsx', sheet_name='Scores')

table = students.merge(scores, how='left', on='ID').fillna(0)  # 指定ID作为join,把merge换成join的话,join可以自己拿index作为索引,就不用on
table.Score = table.Score.astype(int)
print(table)
十七,数据校验
准备
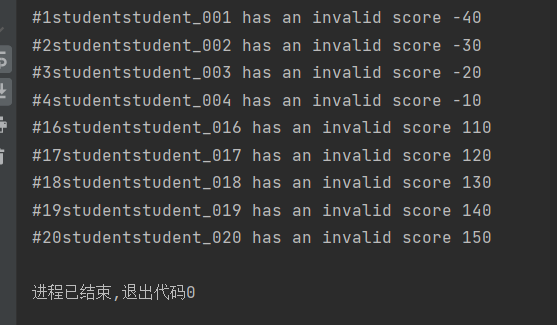
①
    try:
         assert 0<=row.Score<=100
    except:
print(f'#{row.ID}student{row.Name} has an invalid score {row.Score}') #数据抛出
2.代码
try:
assert 0<=row.Score<=100
except:
print(f'#{row.ID}student{row.Name} has an invalid score {row.Score}')
十八,把一列分为两列
准备
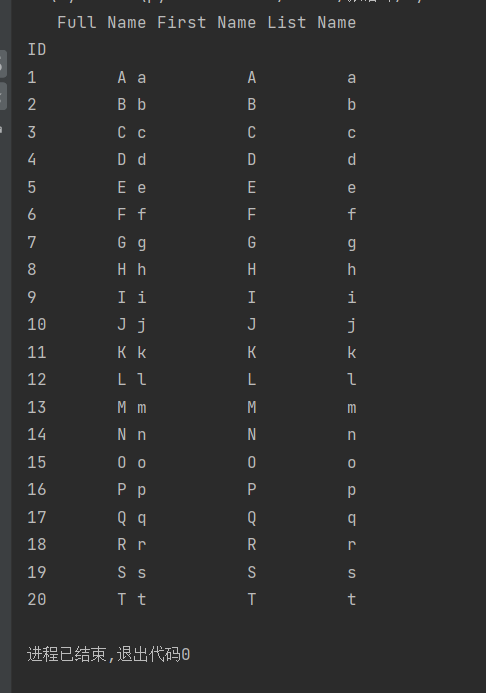
①df=employees['Full Name'].str.split(expand=True) #把Full Name分开,默认空格,分开没有数量要求
②df[0] #这个分开的值在前面
2.代码
import pandas as pd

employees = pd.read_excel('文件位置/18.xlsx', index_col='ID')
df=employees['Full Name'].str.split(expand=True)
employees['First Name']=df[0]
employees['List Name']=df[1]
print(employees)
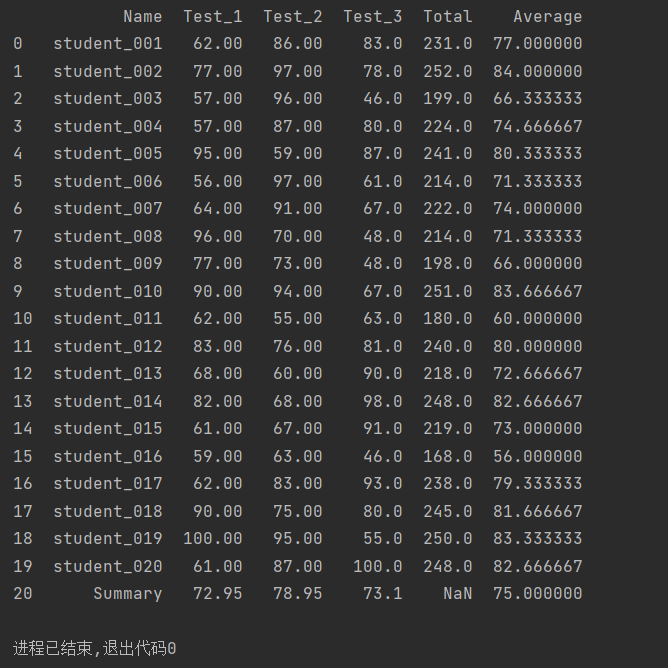
十九,求和求平均值
准备
①axis=1为横向 temp.sum(axis=1) #横向求和
②python中求平均值的方法 mean
2.代码
import pandas as pd

students = pd.read_excel('文件位置/19.xlsx', index_col='ID')

temp=students[['Test_1','Test_2','Test_3']]
# result=temp.sum()
row_sum = temp.sum(axis=1)
row_mean = temp.mean(axis=1)
students['Total']=row_sum
students['Average']=row_mean


col_mean=students[['Test_1','Test_2','Test_3','Average']].mean()
col_mean['Name']='Summary'
students=students.append(col_mean,ignore_index=True)
print(students)
二十,定位消除重复数据
准备
①subset='Name' #这个是通过Name这一列查找重复值
② duplicated() #返回布尔型数据,告诉重复值的位置 #确定有没有重复值,有就是返回True
③print(students.iloc[dupe.index]) #即对数据进行位置索引,从而在数据表中提取出相应的数据。
2.代码
import pandas as pd

students = pd.read_excel('文件位置/20.xlsx')
# students.drop_duplicates(subset='Name',inplace=True,keep='first')
# print(students)

dupe=students.duplicated(subset='Name')
dupe=dupe[dupe==True]
print(students.iloc[dupe.index])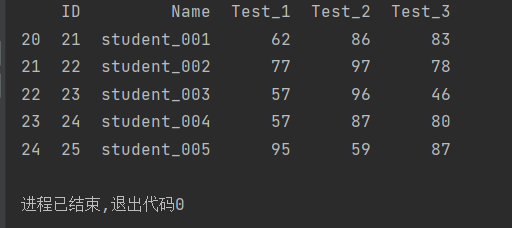


 994
994


 被折叠的 条评论
为什么被折叠?
被折叠的 条评论
为什么被折叠?
 到【灌水乐园】发言


