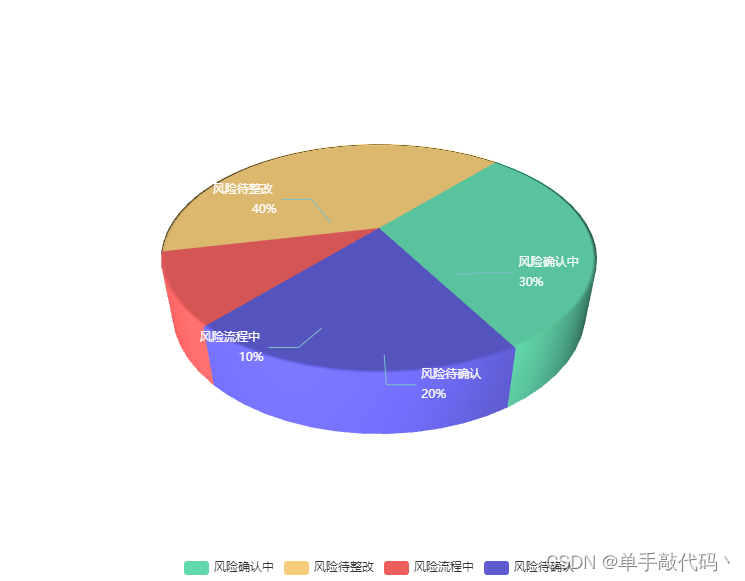
1、效果图
2、代码(使用的html文件类型展示)
<!DOCTYPE html>
<html lang="en">
<head>
  <meta charset="UTF-8">
  <meta name="viewport" content="width=device-width, initial-scale=1.0">
  <title>Document</title>
</head>
<body>
  <div id="chartR2" style="width: 800px;height:600px;"></div>
</body>
<script src="https://cdn.bootcdn.net/ajax/libs/echarts/5.0.2/echarts.min.js"></script>
<script src="https://cdn.bootcdn.net/ajax/libs/echarts-gl/2.0.4/echarts-gl.min.js"></script>

<script>
  var myChart = echarts.init(document.getElementById('chartR2'));
  function initChartR2() {
    const chartDom = document.getElementById('chartR2')
    // this.rightChart2 = this.$echarts.init(chartDom)
    function getParametricEquation(
      startRatio,
      endRatio,
      isSelected,
      isHovered,
      k,
      height
    ) {
      // 计算
      const midRatio = (startRatio + endRatio) / 2

      const startRadian = startRatio * Math.PI * 2
      const endRadian = endRatio * Math.PI * 2
      const midRadian = midRatio * Math.PI * 2

      // 如果只有一个扇形,则不实现选中效果。
      if (startRatio === 0 && endRatio === 1) {
        isSelected = false
      }

      // 通过扇形内径/外径的值,换算出辅助参数 k(默认值 1/3)
      k = typeof k !== 'undefined' ? k : 1 / 3

      // 计算选中效果分别在 x 轴、y 轴方向上的位移(未选中,则位移均为 0)
      const offsetX = isSelected ? Math.cos(midRadian) * 0.1 : 0
      const offsetY = isSelected ? Math.sin(midRadian) * 0.1 : 0

      // 计算高亮效果的放大比例(未高亮,则比例为 1)
      const hoverRate = isHovered ? 1.05 : 1

      // 返回曲面参数方程
      return {
        u: {
          min: -Math.PI,
          max: Math.PI * 3,
          step: Math.PI / 32
        },

        v: {
          min: 0,
          max: Math.PI * 2,
          step: Math.PI / 20
        },

        x: function(u, v) {
          if (u < startRadian) {
            return (
              offsetX +
              Math.cos(startRadian) * (1 + Math.cos(v) * k) * hoverRate
            )
          }
          if (u > endRadian) {
            return (
              offsetX +
              Math.cos(endRadian) * (1 + Math.cos(v) * k) * hoverRate
            )
          }
          return offsetX + Math.cos(u) * (1 + Math.cos(v) * k) * hoverRate
        },

        y: function(u, v) {
          if (u < startRadian) {
            return (
              offsetY +
              Math.sin(startRadian) * (1 + Math.cos(v) * k) * hoverRate
            )
          }
          if (u > endRadian) {
            return (
              offsetY +
              Math.sin(endRadian) * (1 + Math.cos(v) * k) * hoverRate
            )
          }
          return offsetY + Math.sin(u) * (1 + Math.cos(v) * k) * hoverRate
        },

        z: function(u, v) {
          if (u < -Math.PI * 0.5) {
            return Math.sin(u)
          }
          if (u > Math.PI * 2.5) {
            return Math.sin(u)
          }
          return Math.sin(v) > 0 ? 1 * height : -1
        }
      }
    }
    // 生成模拟 3D 饼图的配置项
    function getPie3D(pieData, internalDiameterRatio) {
      const series = []
      let sumValue = 0
      let startValue = 0
      let endValue = 0
      const legendData = []
      const k =
        typeof internalDiameterRatio !== 'undefined'
          ? (1 - internalDiameterRatio) / (1 + internalDiameterRatio)
          : 1 / 3

      // 为每一个饼图数据,生成一个 series-surface 配置
      for (let i = 0; i < pieData.length; i++) {
        sumValue += pieData[i].value

        const seriesItem = {
          name:
            typeof pieData[i].name === 'undefined'
              ? `series${i}`
              : pieData[i].name,
          type: 'surface',
          parametric: true,
          wireframe: {
            show: false
          },
          pieData: pieData[i],
          pieStatus: {
            selected: false,
            hovered: false,
            k: k
          }
        }

        if (typeof pieData[i].itemStyle !== 'undefined') {
          const itemStyle = {}

          typeof pieData[i].itemStyle.color !== 'undefined'
            ? (itemStyle.color = pieData[i].itemStyle.color)
            : null
          typeof pieData[i].itemStyle.opacity !== 'undefined'
            ? (itemStyle.opacity = pieData[i].itemStyle.opacity)
            : null

          seriesItem.itemStyle = itemStyle
        }
        series.push(seriesItem)
      }

      // 使用上一次遍历时,计算出的数据和 sumValue,调用 getParametricEquation 函数,
      // 向每个 series-surface 传入不同的参数方程 series-surface.parametricEquation,也就是实现每一个扇形。
      for (let i = 0; i < series.length; i++) {
        endValue = startValue + series[i].pieData.value
        series[i].pieData.startRatio = startValue / sumValue
        series[i].pieData.endRatio = endValue / sumValue
        series[i].parametricEquation = getParametricEquation(
          series[i].pieData.startRatio,
          series[i].pieData.endRatio,
          false,
          false,
          k,
          2000
        )

        startValue = endValue

        legendData.push(series[i].name)
      }
      return series
    }
    // 传入数据生成 option
    const optionsData = [
      {
        name: '风险确认中',
        value: 30,
        itemStyle: {
          color: '#63D9AE'
        }
      },
      {
        name: '风险待整改',
        value: 40,
        itemStyle: {
          color: '#F4CC7A'
        }
      },
      {
        name: '风险流程中',
        value: 10,
        itemStyle: {
          color: '#EC5E5E'
        }
      },
      {
        name: '风险待确认',
        value: 20,
        itemStyle: {
          color: '#5F5CD2'
        }
      },
    ]
    const series = getPie3D(optionsData.map(item => {
      if (item.value < 5) {
        item.value = 5
      }
      return item
    }), 0, 240, 28, 26, 0.5)
    series.push({
      name: 'pie2d',
      type: 'pie',
      label: {
        opacity: 1,
        position: 'outside',
        fontSize: 12,
        lineHeight: 20,
        textStyle: {
          fontSize: 12,
          color: '#fff'
        }
      },
      labelLine: {
        length: 30,
        length2: 30
      },
      minAngle: 10,
      startAngle: -50, // 起始角度,支持范围[0, 360]。
      clockwise: false, // 饼图的扇区是否是顺时针排布。上述这两项配置主要是为了对齐3d的样式
      radius: ['0', '25%'],
      center: ['50%', '50%'],
      data: optionsData.map(item => {
        item.itemStyle.opacity = 0
        return item
      })
    })
    // 准备待返回的配置项,把准备好的 legendData、series 传入。
    const option = {
      legend: {
        data: ['风险确认中', '风险待整改', '风险流程中','风险待确认'],
        x: 'center',
        y: 'bottom',
      },
      animation: true,
      tooltip: {
        formatter: (params) => {
          if (
            params.seriesName !== 'mouseoutSeries' &&
            params.seriesName !== 'pie2d'
          ) {
            return `${
              params.seriesName
            }<br/><span style="display:inline-block;margin-right:5px;border-radius:10px;width:10px;height:10px;background-color:${
              params.color
            };"></span>${
              option.series[params.seriesIndex].pieData.value + '%'
            }`
          }
        },
        textStyle: {
          fontSize: 14
        }
      },
      title: {
        x: 'center',
        top: '20',
        textStyle: {
          color: '#fff',
          fontSize: 22
        }
      },
      labelLine: {
        show: true,
        lineStyle: {
          color: '#7BC0CB'
        },
        normal: {
          show: true,
          length: 10,
          length2: 10
        }
      },
      label: {
        show: true,
        position: 'outside',
        formatter: '{b} \n{d}%',
        textStyle: {
          color: '#fff',
          fontSize: '12px'
        }
      },
      xAxis3D: {
        min: -1,
        max: 1
      },
      yAxis3D: {
        min: -1,
        max: 1
      },
      zAxis3D: {
        min: -1,
        max: 1
      },
      grid3D: {
        show: false,
        boxHeight: 0.03,
        bottom: '50%',
        viewControl: {
          distance: 300,
          alpha: 35,
          beta: 60,
          autoRotate: false // 自动旋转
        }
      },
      series: series
    }
    myChart.setOption(option)
  }
  initChartR2()
</script>
</html>


 1363
1363

 被折叠的 条评论
为什么被折叠?
被折叠的 条评论
为什么被折叠?
 到【灌水乐园】发言


