


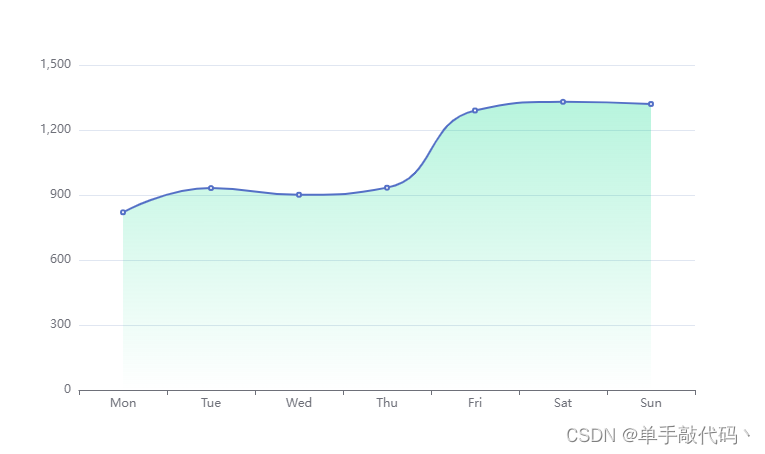
1、效果图
2、代码
option = {
  xAxis: {
      type: 'category',
      data: ['Mon', 'Tue', 'Wed', 'Thu', 'Fri', 'Sat', 'Sun']
  },
  yAxis: {
      type: 'value'
  },
  series: [{
      data: [820, 932, 901, 934, 1290, 1330, 1320],
      type: 'line',
      smooth:'true',
      // 在这里设置线条的渐变色
      areaStyle: {
          color: new echarts.graphic.LinearGradient(0, 0, 0, 1, [{
              offset: 0,
              color: 'rgba(0, 216, 135, 0.4)' // 渐变起始颜色
          }, {
              offset: 1,
              color: 'rgba(0, 216, 135, 0)' // 渐变结束颜色
          }])
      }
  }]
};


 1万+
1万+

 被折叠的 条评论
为什么被折叠?
被折叠的 条评论
为什么被折叠?
 到【灌水乐园】发言


