


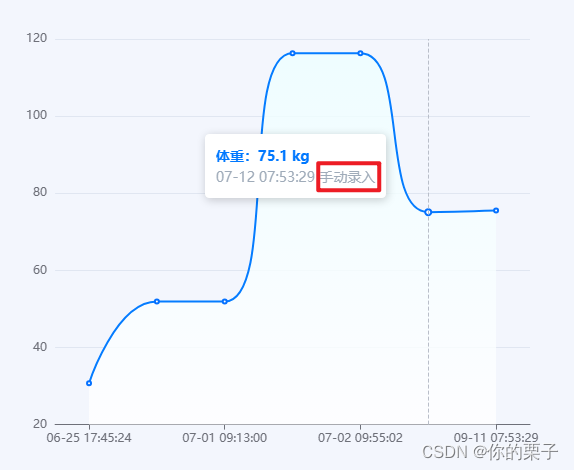
先看看效果图!
看过Echarts官网例子以及文档的小伙伴们,不难知道,鼠标移入的配置项是tooltip这个参数
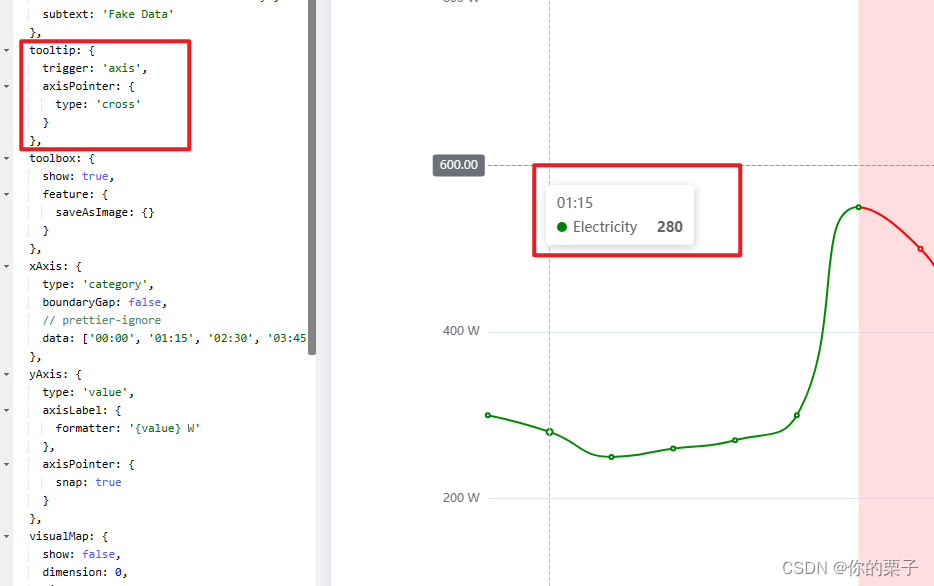
那么,如何给这个提示加入除了X轴和Y轴的数据外,显示其他的参数。.
废话不多说,直接看代码
 <div class="echart" style="width: 600px; height: 600px;">
        <div ref="weight" style="width: 100%; height: 480px;"></div>
    </div>
const curveInit = () => {
    var weightChart: any = echarts.init(weight.value, 'null', { height: 480 });
    weightChart.clear()
    weightChart.setOption(curveOption);
}
const curveOption = reactive({
    color: ['#0571FF'],
    tooltip: {
        trigger: 'axis',
        axisPointer: {
            type: 'line',
            snap: true
        },
        formatter: function (params: any) {
            let str = `<span style='color:#0078FF;font-size:14px;font-weight:700'>体重:${params[0].data[1]} kg</span> <br>
            <span style='color:#9FABB9'>${params[0].data[0]}   ${params[0].data[2]}</span>`
            return str
        },
    },
    xAxis: {
        type: 'category',
        // data: series.data.key,
        axisTick: {
            alignWithLabel: true
        },
        axisLabel: {
            alignWithLabel: true,
        },
        axisPointer: {
            snap: true
        },
    },
    yAxis: {
        type: 'value',
        scale: true
    },
    series: [
        {
            type: 'line',
            stack: 'Total',
            smooth: true,
            lineStyle: {
                width: 2
            },

            areaStyle: {
                opacity: 0.8,
                color: new echarts.graphic.LinearGradient(0, 0, 0, 1, [
                    {
                        offset: 0,
                        color: '#D8E9FF'
                    },
                    {
                        offset: 1,
                        color: '#FBFDFF'
                    }
                ])
            },
            emphasis: {
                focus: 'series'
            },
            data: [] as any
        }
    ],
    grid: {
        left: '6%',
        right: '10%',
        bottom: '3%',
        containLabel: true
    }
})

onMounted(async () => {
    await getweightCurve()   //调用接口 拿数据
    curveOption.series[0].data = weightCurve.value.weightRecordListV2
    curveInit()
})
getweightCurve()为调用接口,拿数据,就不在此做过多的展示。
weightCurve.value.weightRecordListV2的数据格式如下:
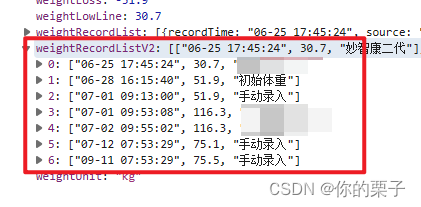
通过{params[0].data[2]}可以去拿到数据的第三个参数。
亲测有效!!!家人们试试吧!!!


 3496
3496

 被折叠的 条评论
为什么被折叠?
被折叠的 条评论
为什么被折叠?
 到【灌水乐园】发言


