


微信小程序–使用antv F2绘制环形图表
参考网址:https://blog.csdn.net/miracle__Y/article/details/105081681
官网地址:https://f2.antv.antgroup.com/tutorial/getting-started
1、引入antv F2
npm i @antv/f2-canvas
2、在页面中使用
- 在demo.json中引入
{
  "usingComponents": {
    "ff-canvas": "@antv/f2-canvas"
  }
}
- 在wxml中使用组件
<view class="container" style="height: 400rpx;width: 100vw;">
  <ff-canvas id="column-dom" canvas-id="column" opts="{{ opts }}"></ff-canvas>
</view>
- 处理图表数据
let chart = null;
function initChart(canvas, width, height, F2) { // 使用 F2 绘制图表
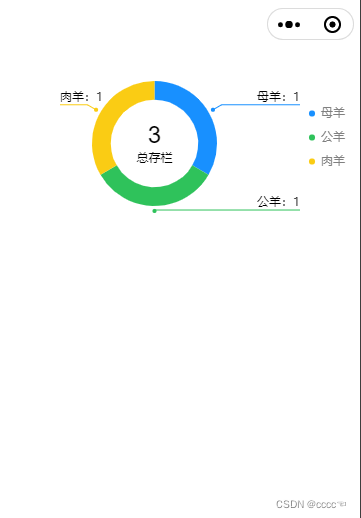
const data = [{
name: '母羊',
percent:1,
a: '1',
},
{
name: '公羊',
percent:1,
a: '1',
},
{
name: '肉羊',
percent:1,
a: '1',
},
];
chart = new F2.Chart({
el: canvas,
width,
height
});
chart.source(data);
chart.coord({
// type的属性:饼图:polar,柱形:rect
// type: 'rect',
type: 'polar',
transposed: true,
innerRadius: 0.7,// 内半径
radius: 0.85,// 半径
});
chart.axis(false);//坐标系
chart.legend({
position: 'right'
})//图例位置
chart.pieLabel({
sidePadding:60,
label1: (data) => {
return {
text: data.name+':'+ data.percent,
fill: '#000',
};
}
});
chart.interval().position('a*percent').color('name').adjust('stack');
chart.guide().text({
position: ['50%', '45%'], // 文本位置,百分比表示相对于容器的位置
content: '3', // 显示的文本内容
style: {
fontSize: 24, // 文字大小
textAlign: 'center', // 文字水平对齐方式
textBaseline: 'middle', // 文字垂直对齐方式
fill: '#000' // 文字颜色
}
});
chart.guide().text({
position: ['50%', '60%'], // 文本位置,百分比表示相对于容器的位置
content: '总存栏', // 显示的文本内容
style: {
fontSize: 12, // 文字大小
textAlign: 'center', // 文字水平对齐方式
textBaseline: 'middle', // 文字垂直对齐方式
fill: '#000' // 文字颜色
}
});
chart.render();
// 调用自定义函数添加文本
return chart;
}
Page({
data: {
opts: {
onInit: initChart
}
},
onReady() {}
});
效果图:


 6303
6303


 被折叠的 条评论
为什么被折叠?
被折叠的 条评论
为什么被折叠?
 到【灌水乐园】发言


