


Developed by Ruofan Ding, Xudong Zou, Yangmei Qin, Gao Wang, Lei Li
xQTLbiolinks: a comprehensive and scalable tool for integrative analysis of molecular QTLs
xQTLbiolinks is a end-to-end bioinformatic tool for efficient mining and analyzing public and user-customized xQTLs data for the discovery of disease susceptibility genes. xQTLbiolinks consists of tailored functions that can be grouped into four modules: Data retrieval, Pre-processing, Analysis and Visualization.
Instructions, documentation, and tutorials can be found at here.
Quick Start
xQTLbiolinkscan be installed and used on any operator systems supporting R. The latest version (v1.6.3) is also available at GitHub repository and it can be installed throughdevtools::install_github("dingruofan/xQTLbiolinks”). For more details, please refer to the instructions at Installation section below.- Find the Query and download for xQTLs, gene, variant, tissue, sample and expressions.
- Find the Quick Start for a quick application of colocalization analysis with xQTLbiolinks. Go through a whole Case study of detection of casual vairants and genes in prostate cancer using
xQTLbiolinks. - The details and instructions of all functions implemented in xQTLbiolinks can be found here. Find more instructions with examples for visualizations here.
Citation
If you find the xQTLbiolinks package or any of the source code in this repository useful for your work, please cite:
Ruofan Ding, Xudong Zou, Yangmei Qin, Lihai Gong, Hui Chen, Xuelian Ma, Shouhong Guang, Chen Yu, Gao Wang, Lei Li, xQTLbiolinks: a comprehensive and scalable tool for integrative analysis of molecular QTLs, Briefings in Bioinformatics, Volume 25, Issue 1, January 2024, bbad440,
Institute of Systems and Physical Biology, Shenzhen Bay Laboratory, Shenzhen 518055, China
Dependencies
The xQTLbiolinks package has the following dependencies:
R packages: BiocGenerics, cowplot (>= 1.1.1), curl (>= 4.3.2), data.table (>= 1.14.2), DBI, SummarizedExperiment, GenomeInfoDb, GenomicFeatures, GenomicRanges, ggplot2 (>= 3.3.6), ggrepel, IRanges, jsonlite (>= 1.7.2), viridis, RMySQL, stringr (>= 1.4.0), utils (>= 4.0.3),VariantAnnotation, TxDb.Hsapiens.UCSC.hg38.knownGene, PupillometryR, coloc, hyprcoloc, knitr, rtracklayer, usethis, ggridges, CMplot, R.utils, ggforestplot.
Installation
To install this R package, you will need to have required package SummarizedExperiment installed from Bioconductor with following command:
if (!require("BiocManager", quietly = TRUE)){install.packages("BiocManager")}
BiocManager::install("SummarizedExperiment") # For windows or linux
BiocManager::install("SummarizedExperiment",type="source") # For MAC
Once you have installed the required package, you can then install xQTLbiolinks from CRAN or github(recommended) using following command:
# Install from github to get the latest version.
if(!require("devtools")){install.packages("devtools")}
devtools::install_github("dingruofan/xQTLbiolinks")
4. Visualization using xQTLbiolinks
2023-05-01
Source: vignettes/visualization.Rmd
Some visual examples are provided in this vignette, including example data, code, and figures.
Visualilzation of eQTL, sQTL, gene expression across tissues.
xQTLvisual_eqtl("KIF15")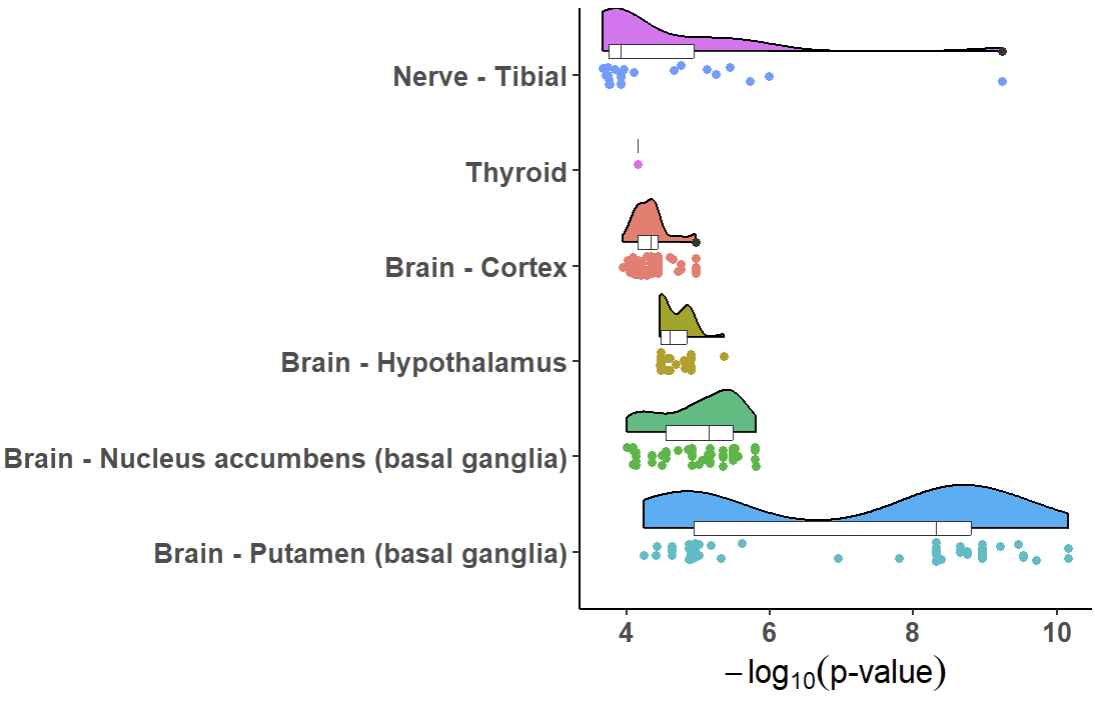
 genes <- c("FNDC8", "S100Z", "AQP6", "AMOT", "C3orf38", "FOXL1", "COX11", "FCN3", "DDX58", "CFI", "MS4A18", "NUDT13", "HOXA4", "VSX1")
 xQTLvisual_genesExp(genes, tissueSiteDetail="Lung")
geneExpTissues <- xQTLvisual_geneExpTissues("TP53", tissues=c("Lung", "Brain","Ovary"))
geneExpTissues <- xQTLvisual_geneExpTissues("TP53")
expEqtl <- xQTLvisual_eqtlExp(variantName="rs78378222", gene ="TP53",
                              tissueSiteDetail="Lung")
expEqtl
expSqtl <- xQTLvisual_sqtlExp(variantName="chr11_66561248_T_C_b38",variantType="variantId",
                              phenotypeId ="chr11:66348070:66353455:clu_8500:ENSG00000255468.6",
                              tissueSiteDetail="Skin - Sun Exposed (Lower leg)")
expSqtl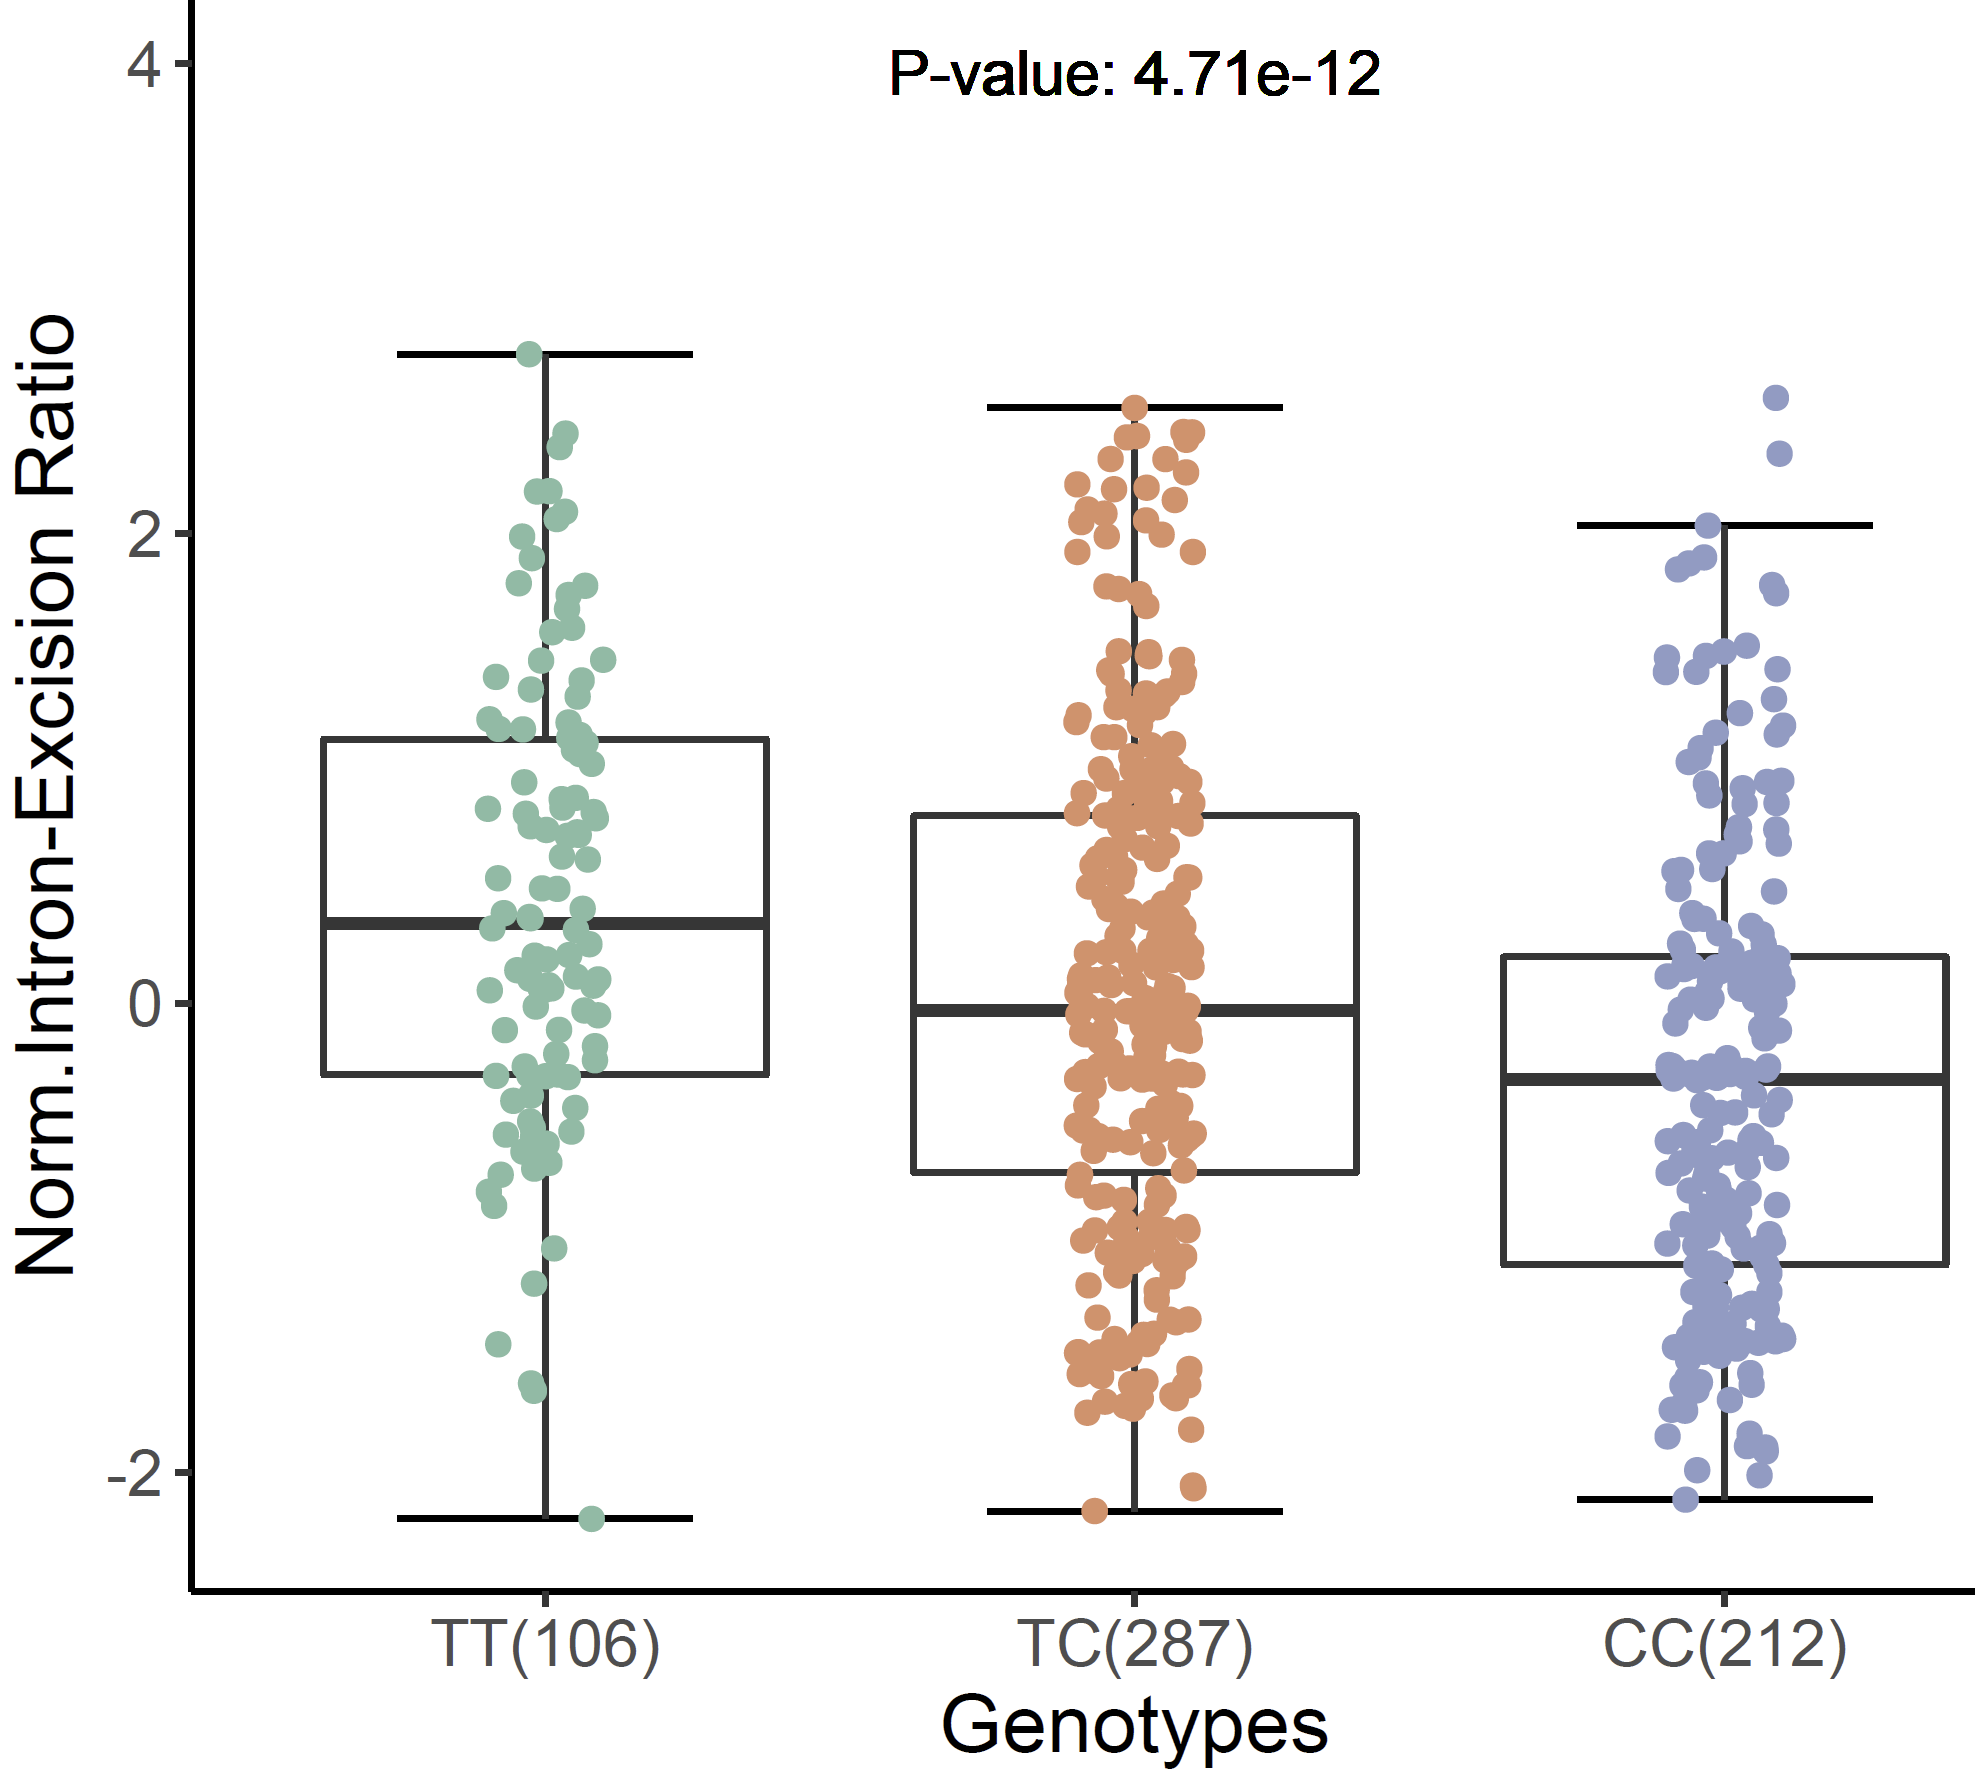
LocusZoom plot for GWAS dataset:
library(data.table)
gwasDF <- fread("https://gitee.com/stronghoney/exampleData/raw/master/gwasChr6Sub4.txt")
p_all <- xQTLvisual_locusZoom(gwasDF)
p_sub <- xQTLvisual_locusZoom(gwasDF, posRange="chr6:4.7e7-4.8e7", population ="EUR")
cowplot::plot_grid(p_all, p_sub, align = "h", ncol = 2)
LocusZoom plot for eQTL signals of a gene of interest:
eqtlAsso <- xQTLdownload_eqtlAllAsso("RP11-385F7.1",
                                     tissueLabel = "Brain - Cortex")
p_all <- xQTLvisual_locusZoom(eqtlAsso[,c("snpId", "chrom", "pos", "pValue")], highlightSnp="rs4711878" )
p_sub <- xQTLvisual_locusZoom(eqtlAsso[,c("snpId", "chrom", "pos", "pValue")], highlightSnp="rs4711878",
                              posRange="chr6:47.3e6-47.9e6")
cowplot::plot_grid(p_all, p_sub, align = "h", ncol = 2)
library(data.table)
eqtlDF <-fread("https://gitee.com/stronghoney/exampleData/raw/master/eqtl/eqtlAsso1.txt")
gwasDF <-fread("https://gitee.com/stronghoney/exampleData/raw/master/gwas/AD/gwasChr6Sub3.txt")
xQTLvisual_locusCompare( eqtlDF, gwasDF, legend_position="topleft")
gwasEqtldata <- data.table::fread("http://bioinfo.szbl.ac.cn/xQTL_biolinks/xqtl_data/gwas/AD/gwasEqtldata.txt")
xQTLvisual_locusCombine(gwasEqtldata, highlightSnp="rs13120565")
xQTLvisual_coloc( gene="MMP7", variantName="rs11568818", study="TwinsUK")
Developed by Ruofan Ding, Xudong Zou, Yangmei Qin, Gao Wang, Lei Li.


 被折叠的 条评论
为什么被折叠?
被折叠的 条评论
为什么被折叠?
 到【灌水乐园】发言


