1.父组件中使用及样式
        <div class="contain">
            <div class="flex-contain">
              <BasicPieChart ref="BasicPieChartSpeed"/>
            </div>
            <div class="flex-contain">
              <Dendrogram ref="DendrogramGrade"/>
            </div>
            <div class="flex-contain">
              <BasicPieChart ref="BasicPieChartRect"/>
            </div>
            <div class="flex-contain f-2">
              <Dendrogram ref="DendrogramTrend"/>
            </div>
            <div class="flex-contain">
              <BasicPieChart ref="BasicPieChartCompletion"/>
            </div>
        </div>
this.$refs.DendrogramTrend.setConfig((data) => {
data.dataset.source = [
['product', '2020', '2021', '2022'],
['A级', 41.1, 30.4, 65.1, 53.3],
['B级', 86.5, 92.1, 85.7, 83.1],
['C级', 24.1, 67.2, 79.5, 86.4],
['D级', 24.1, 67.2, 79.5, 86.4]
]
data.series = [
{ type: 'bar', seriesLayoutBy: 'row' },
{ type: 'bar', seriesLayoutBy: 'row' },
{ type: 'bar', seriesLayoutBy: 'row' },
{ type: 'bar', seriesLayoutBy: 'row' }
]
return data
})
this.$refs.DendrogramGrade.setConfig((data) => {
data.title.text = ''
data.legend.show = false
data.dataset.source = [
['product', '2022'],
['A级', 41.1],
['B级', 86.5],
['C级', 24.1],
['D级', 10]
]
data.series = [
{ type: 'bar', seriesLayoutBy: 'column', itemStyle: {
normal: {
color: function(params) {
var colorList = [
'#C1232B', '#B5C334', '#FCCE10', '#E87C25', '#27727B'
]
return colorList[params.dataIndex]
}
}
}
}
]
return data
})
this.$refs.BasicPieChartSpeed.setConfig((data) => {
data.title.text = ''
data.series[0].name = ''
data.series[0].data = [
{ value: 30, name: '未评分' },
{ value: 30, name: '评分中' },
{ value: 40, name: '已完结' }
]
return data
})
this.$refs.BasicPieChartRect.setConfig((data) => {
data.title.text = ''
data.series[0].name = ''
data.series[0].data = [
{ value: 30, name: '未整改' },
{ value: 30, name: '整改中' },
{ value: 40, name: '已整改' }
]
return data
})
this.$refs.BasicPieChartCompletion.setConfig((data) => {
data.title.text = ''
data.series[0].name = ''
data.series[0].center = ['51%', '50%']
data.series[0].radius = ['30%', '50%']
data.series[0].avoidLabelOverlap = true
data.graphic = [{
type: 'text',
left: '38%',
top: '45%',
style: {
text: '72%' + '\n' + '完成进度',
textAlign: 'center',
fill: '#FFF',
fontSize: 20
}
}]
data.series[0].label = {
show: false
}
data.series[0].labelLine = {
show: false
}
data.series[0].data = [
{ value: 28, name: '评分中' },
{ value: 78, name: '已完结' }
]
return data
})
<style lang="scss" scoped>
.contain{
    width: 100%;
    height: 100%;
    display: flex;
    flex-wrap: wrap;
    padding: 10px 0 10px 10px;
    background: #00217f;
    .flex-contain {
        display: flex;
        height: calc(50% - 5px);
        overflow: hidden;
        flex-basis: calc(100%/3 - 10px);
        margin: 0 10px 10px 0;
        border: solid 1px #00ffff;
    }
    .f-2 {
        flex-grow: 2;
    }
}
</style>
2.echarts组件
<template>
<div ref="BasicPieChart" style="width: 100%;height: 100%;"></div>
</template>
<script>
import echarts from 'echarts'
export default {
mounted() {
this.myEcharts()
window.addEventListener('resize', this.resizeChart)
},
beforeDestroy() {
this.myChart && this.myChart.dispose()
window.removeEventListener('resize')
},
data() {
return {
myChart: null,
option: {
color: ['#C1232B', '#B5C334', '#FCCE10', '#E87C25', '#27727B'],
title: {
text: '鱼鱼测试标题',
textStyle: {
fontSize: 20,
color: '#81d3f8'
}
},
tooltip: {
trigger: 'item'
},
legend: {
orient: 'vertical',
icon: 'circle',
right: '5%',
top: '45%',
textStyle: {
color: '#fff'
}
},
label: {
show: true,
formatter: ({ name, value }) => {
return `${name}${value}家`
}
},
series: [
{
name: '',
type: 'pie',
radius: '50%',
left: '-12%',
data: [],
label: {
fontSize: 16
},
emphasis: {
label: {
show: true,
fontSize: '16',
fontWeight: 'bold'
},
itemStyle: {
shadowBlur: 10,
shadowOffsetX: 0,
shadowColor: 'rgba(0, 0, 0, 0.5)'
}
}
}
]
}
}
},
watch: {
option: {
deep: true,
handler() {
this.myEcharts()
}
}
},
methods: {
setConfig(fun) {
this.option = fun(this.option)
},
myEcharts() {
if (!this.myChart) {
this.myChart = echarts.init(this.$refs.BasicPieChart)
}
this.myChart.setOption(this.option)
},
resizeChart() {
this.myChart && this.myChart.resize()
}
}
}
</script>
<style scoped></style>
<template>
<div ref="dendrogram" style="width: 100%;height: 100%;"></div>
</template>
<script>
import echarts from 'echarts'
export default {
mounted() {
this.myEcharts()
window.addEventListener('resize', this.resizeChart)
},
beforeDestroy() {
this.myChart && this.myChart.dispose()
window.removeEventListener('resize')
},
data() {
return {
myChart: null,
option: {
title: {
text: '鱼鱼测试标题',
textStyle: {
fontSize: 20,
color: '#81d3f8'
}
},
color: ['#C1232B', '#B5C334', '#FCCE10', '#E87C25', '#27727B'],
legend: {
show: true,
icon: 'circle',
right: '2%',
top: '2%',
orient: 'vertical',
textStyle: {
color: '#fff'
}
},
label: {
show: true
},
tooltip: {},
dataset: {
source: []
},
xAxis: {
type: 'category',
axisLine: {
lineStyle: {
color: '#00ffff'
}
},
axisLabel: {
color: '#FFF'
}
},
yAxis: {
axisLine: {
show: false,
lineStyle: {
color: '#00ffff'
}
},
axisLabel: {
color: '#FFF'
},
splitLine: {
lineStyle: {
color: '#00ffff'
}
}
},
series: []
}
}
},
watch: {
option: {
deep: true,
handler() {
this.myEcharts()
}
}
},
methods: {
setConfig(fun) {
this.option = fun(this.option)
},
myEcharts() {
if (!this.myChart) {
this.myChart = echarts.init(this.$refs.dendrogram)
}
this.myChart.setOption(this.option)
},
resizeChart() {
this.myChart && this.myChart.resize()
}
}
}
</script>
<style scoped></style>


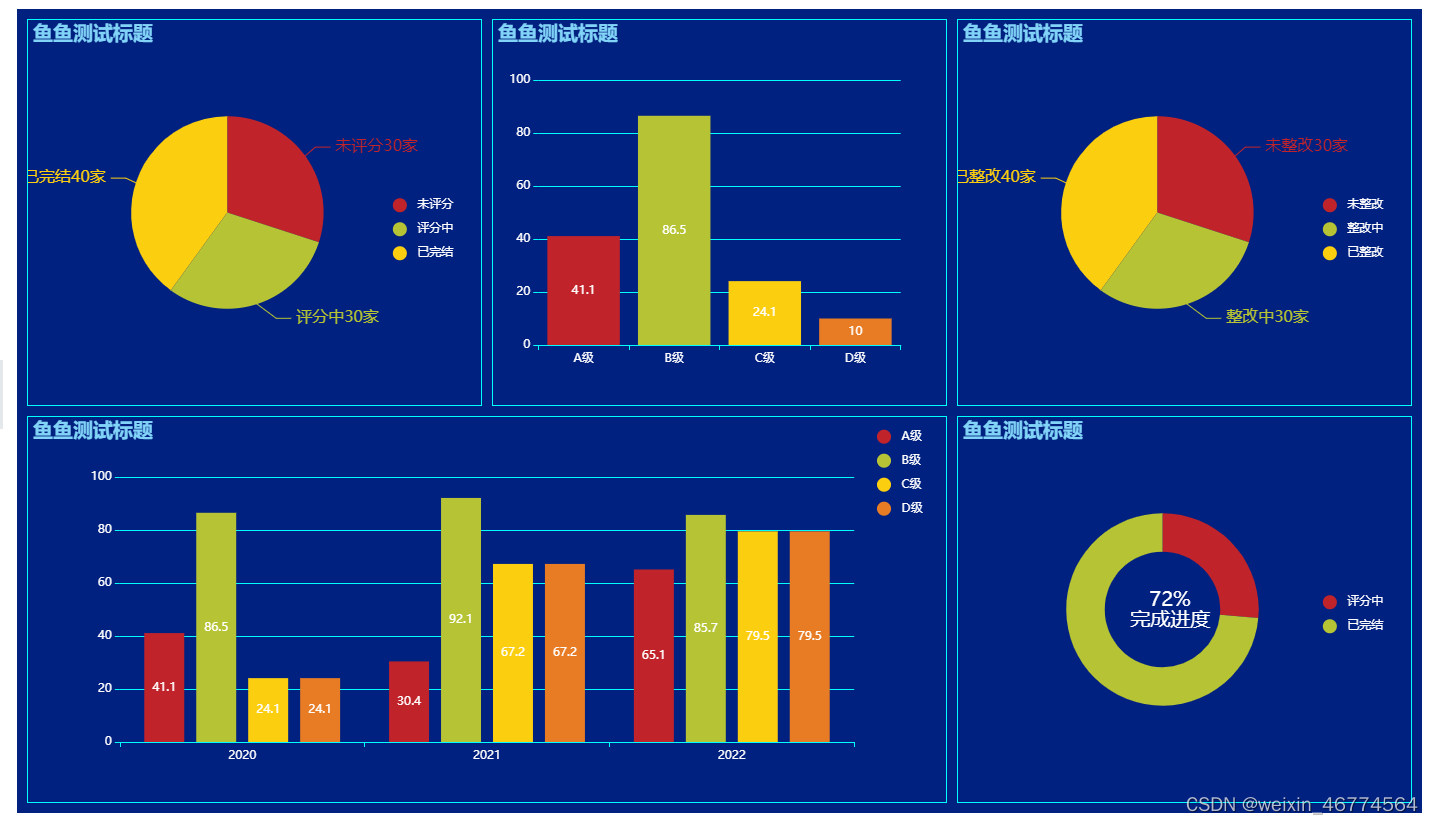
 本文介绍了如何在父组件中使用ECharts组件,展示了BasicPieChart、Dendrogram和不同类型的柱状图,并详细展示了如何在不同图表上进行数据配置,包括设置标题、系列、颜色和自定义样式。


 372
372

 被折叠的 条评论
为什么被折叠?
被折叠的 条评论
为什么被折叠?
 到【灌水乐园】发言


