


Node.js :是运行在服务端的 JavaScript。Node.js是一个事件驱动I/O服务端JavaScript环境,基于Google的V8引擎,V8引擎执行Javascript的速度非常快,性能非常好。 目的:前后端完全分离 后端Python/Java 前端Node.js
Vue: The Progressive JavaScript Framework 目前最为流行的前端框架之一,不可否认的是它相比 React 的学习曲线要更为平缓。
NPM/Yarn:他们都是包管理⼯具,NPM 已随 Node.js 默认安装。
VITE:Native-ESM powered web dev build tool. ⾯向未来的前端构建⼯具。
环境配置:
1.安装NodeJS(自带包管理器NPM),http://nodejs.cn/download/
测试安装成功在控制台运行:node --version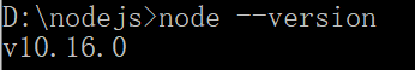
2.测试:写一个server.js文件
运行它:node server.js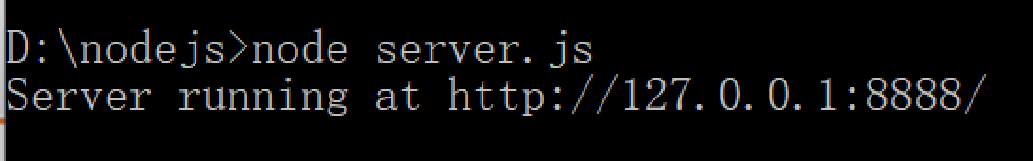

3.安装vue,控制台:npm install vue
4.安装vite,控制台:npm install vite
5.安装yarn,npm install -g yarn
6.创建一个vue空工程:npm init vite-app hellovue
7.运行这个Web工程:npm run dev

Vue+D3可视化
- 安装D3依赖:yarn add d3
- 安装Axios:yarn add axios
- 在目录下的public文件夹下创建json文件:test.json
- 在 src/components 文件夹下新建 BarChart.vue 文件。
BarChart.vue代码:
<template>
  <h2>📊 直方图</h2>
  <div id="bar-chart-container"></div>
</template>

<script>
import { defineComponent } from "vue";
import axios from "axios";
import * as d3 from "d3";

export default defineComponent({
  data() {
    return {
      color: "steelblue",
      margin: { top: 30, right: 0, bottom: 30, left: 40 },
    };
  },
  /**
   * 在挂载后即开始执行
   */
  mounted() {
    axios.get("./test.json").then((res) => {
      const barChartData = Object.assign(this.formatData(res.data), {
        format: "%",
        y: "↑ Frequency",
      });
      this.drawBarChart(barChartData);
    });
  },

  methods: {
    /**
     * 格式化数据
     */
    formatData(data) {
      return data
        .map(({ letter, frequency }) => {
          return { name: letter, value: frequency };
        })
        .sort((a, b) => d3.descending(a.value, b.value));
    },

    /**
     * 绘制直方图
     */
    drawBarChart(data) {
      const margin = this.margin;

      const width = 800;
      const height = 500;

      // 初始化 SVG 元素
      const svg = d3
        .select("#bar-chart-container")
        .append("svg")
        .attr("class", "bar-chart")
        .attr("viewBox", `0 0 ${width} ${height}`)
        .attr("width", width)
        .attr("height", height)
        .append("g");

      // https://observablehq.com/@d3/d3-scaleband
      // x 轴的缩放比例尺
      const x = d3
        .scaleBand()
        .domain(d3.range(data.length))
        .range([margin.left, width - margin.right])
        .padding(0.1);

      // y 轴的缩放比例尺
      const y = d3
        .scaleLinear()
        .domain([0, d3.max(data, (d) => d.value)])
        .nice()
        .range([height - margin.bottom, margin.top]);

      // x 坐标轴
      // tickSizeOuter(0) 移除 0 处初始的标记
      // tickFormat https://github.com/d3/d3-scale/blob/master/README.md#tickFormat
      const xAxis = (g) =>
        g.attr("transform", `translate(0,${height - margin.bottom})`).call(
          d3
            .axisBottom(x)
            .tickFormat((i) => data[i].name)
            .tickSizeOuter(0)
        );

      // y 坐标轴
      const yAxis = (g) =>
        g
          .attr("transform", `translate(${margin.left},0)`)
          .call(d3.axisLeft(y).ticks(null, data.format))
          // 移除区域间的竖线
          .call((g) => g.select(".domain").remove())
          .call((g) =>
            g
              .append("text")
              .attr("x", -margin.left)
              .attr("y", 10)
              .attr("fill", "currentColor")
              .attr("text-anchor", "start")
              .text(data.y)
          );

      svg
        .append("g")
        .attr("fill", this.color)
        .selectAll("rect")
        .data(data)
        .join("rect")
        .attr("x", (d, i) => x(i))
        .attr("y", (d) => y(d.value))
        .attr("height", (d) => y(0) - y(d.value))
        .attr("width", x.bandwidth());

      // 绘制到 SVG
      svg.append("g").call(xAxis);
      svg.append("g").call(yAxis);
    },
  },
});
</script>
App.vue:
<template>
  <img alt="Vue logo" src="./assets/logo.png" />
  <HelloWorld msg="Hello Vue" />
  <bar-chart />
</template>

<script>
import BarChart from './components/BarChart.vue';
import HelloWorld from './components/HelloWorld.vue';

export default {
  name: 'App',
  components: {
    HelloWorld,
    BarChart

  }
}
</script>
运行结果:


 893
893


 被折叠的 条评论
为什么被折叠?
被折叠的 条评论
为什么被折叠?
 到【灌水乐园】发言


