


Sklearn工具包中的参数
《跟着迪哥学Python数据分析与机器学习实战》
https://sklearn.org/
报错一
from sklearn.datasets.california_housing import fetch_california_housing
修改
D:\software\Anaconda\Anaconda3\Lib\site-packages\sklearn\datasets_california_housing
from sklearn.datasets._california_housing import fetch_california_housing
在Windows上安装配置Graphviz
1.下载安装包graphviz下载地址为https://graphviz.org/download/
2.双击.exe,一直选择next(安装路径为D:\software\Graphviz),安装完成之后会在windows开始菜单创建快捷信息
3.配置环境变量,计算机→属性→高级系统设置→高级→环境变量→系统变量→path,在path中加入路径D:\software\Graphviz\bin
4.在windows命令行界面输入dot -version,然后按回车,如果显示如下图所示的graphviz相关版本信息,则安装配置成功。

报错二
No module named ‘sklearn.grid_search’
from sklearn.grid_search import GridSearchCV
#版本老了不支持了
修改
from sklearn.model_selection import GridSearchCV
报错三
AttributeError: ‘GridSearchCV’ object has no attribute ‘grid_score_’
grid.grid_score_,grid.best_params_,grid.best_score_
修改
grid_scores_在sklearn0.20版本中已被删除,取而代之的是cv_results_
grid.cv_results_,grid.best_params_,grid.best_score_
代码与注释
%matplotlib inline
import matplotlib.pyplot as plt
import pandas as pd
#D:\software\Anaconda\Anaconda3\Lib\site-packages\sklearn\datasets\_california_housing
from sklearn.datasets._california_housing import fetch_california_housing
housing = fetch_california_housing()
print(housing.DESCR)

housing.data.shape
(20640, 8)
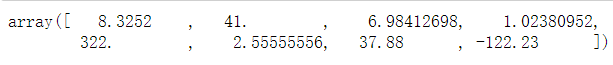
housing.data[0]
from sklearn import tree
dtr = tree.DecisionTreeRegressor(max_depth = 2)
dtr.fit(housing.data[:, [6, 7]], housing.target)
DecisionTreeRegressor(max_depth=2)
#要可视化显示 首先需要安装 graphviz  http://www.graphviz.org/Download..php
dot_data = \
    tree.export_graphviz(dtr,
                         out_file=None,
                         feature_names=housing.feature_names[6:8],
                         filled=True,
                         impurity=False,
                         rounded=True)
#pip install pydotplus
import pydotplus
graph=pydotplus.graph_from_dot_data(dot_data)
graph.get_nodes()[7].set_fillcolor("#FFF2DD")
from IPython.display import Image
Image(graph.create_png())

graph.write_png("dtr_white_background.png")
True
from sklearn.model_selection import train_test_split #切分数据集
data_train,data_test,target_train,target_test = \
    train_test_split(housing.data, housing.target, test_size = 0.1, random_state = 42)
dtr = tree.DecisionTreeRegressor(random_state = 42)
dtr.fit(data_train, traget_train)
dtr.score(data_test, target_test)
0.6310922690494536
from sklearn.ensemble import RandomForestRegressor
rfr=RandomForestRegressor(random_state=42)
rfr.fit(data_train,target_train)
rfr.score(data_test,target_test)
0.8103647255362918
#from sklearn.grid_search import GridSearchCV
from sklearn.model_selection import GridSearchCV
tree_param_grid={'min_samples_split':list((3,6,9)),'n_estimators':list((10,50,100))}
grid=GridSearchCV(RandomForestRegressor(),param_grid=tree_param_grid,cv=5) #交叉验证5次
grid.fit(data_train,target_train)
#grid.grid_score_,grid.best_params_,grid.best_score_
grid.cv_results_,grid.best_params_,grid.best_score_


rfr=RandomForestRegressor(min_samples_split=3,n_estimators=100,random_state=42)
rfr.fit(data_train,traget_train)
rfr.score(data_test,traget_test)
0.8096755084021448
pd.Series(rfr.feature_importances_,index=housing.feature_names).sort_values(ascending = False)
MedInc 0.524244
AveOccup 0.137907
Latitude 0.090685
Longitude 0.089255
HouseAge 0.053957
AveRooms 0.044554
Population 0.030329
AveBedrms 0.029069
dtype: float64
认真是一种态度更是一种责任


 3647
3647


 被折叠的 条评论
为什么被折叠?
被折叠的 条评论
为什么被折叠?
 到【灌水乐园】发言


