


Python绘图功能十分强大,本次Python游乐园为大家带来Python绘制极坐标图的代码,希望可以对大家有所帮助。
import numpy as np
import matplotlib.pyplot as plt
# 设置图片清晰度
plt.rcParams['figure.dpi'] = 300
# 创建画布和子图
fig, axes = plt.subplots(2, 2, figsize=(10, 10), subplot_kw={'projection': 'polar'})
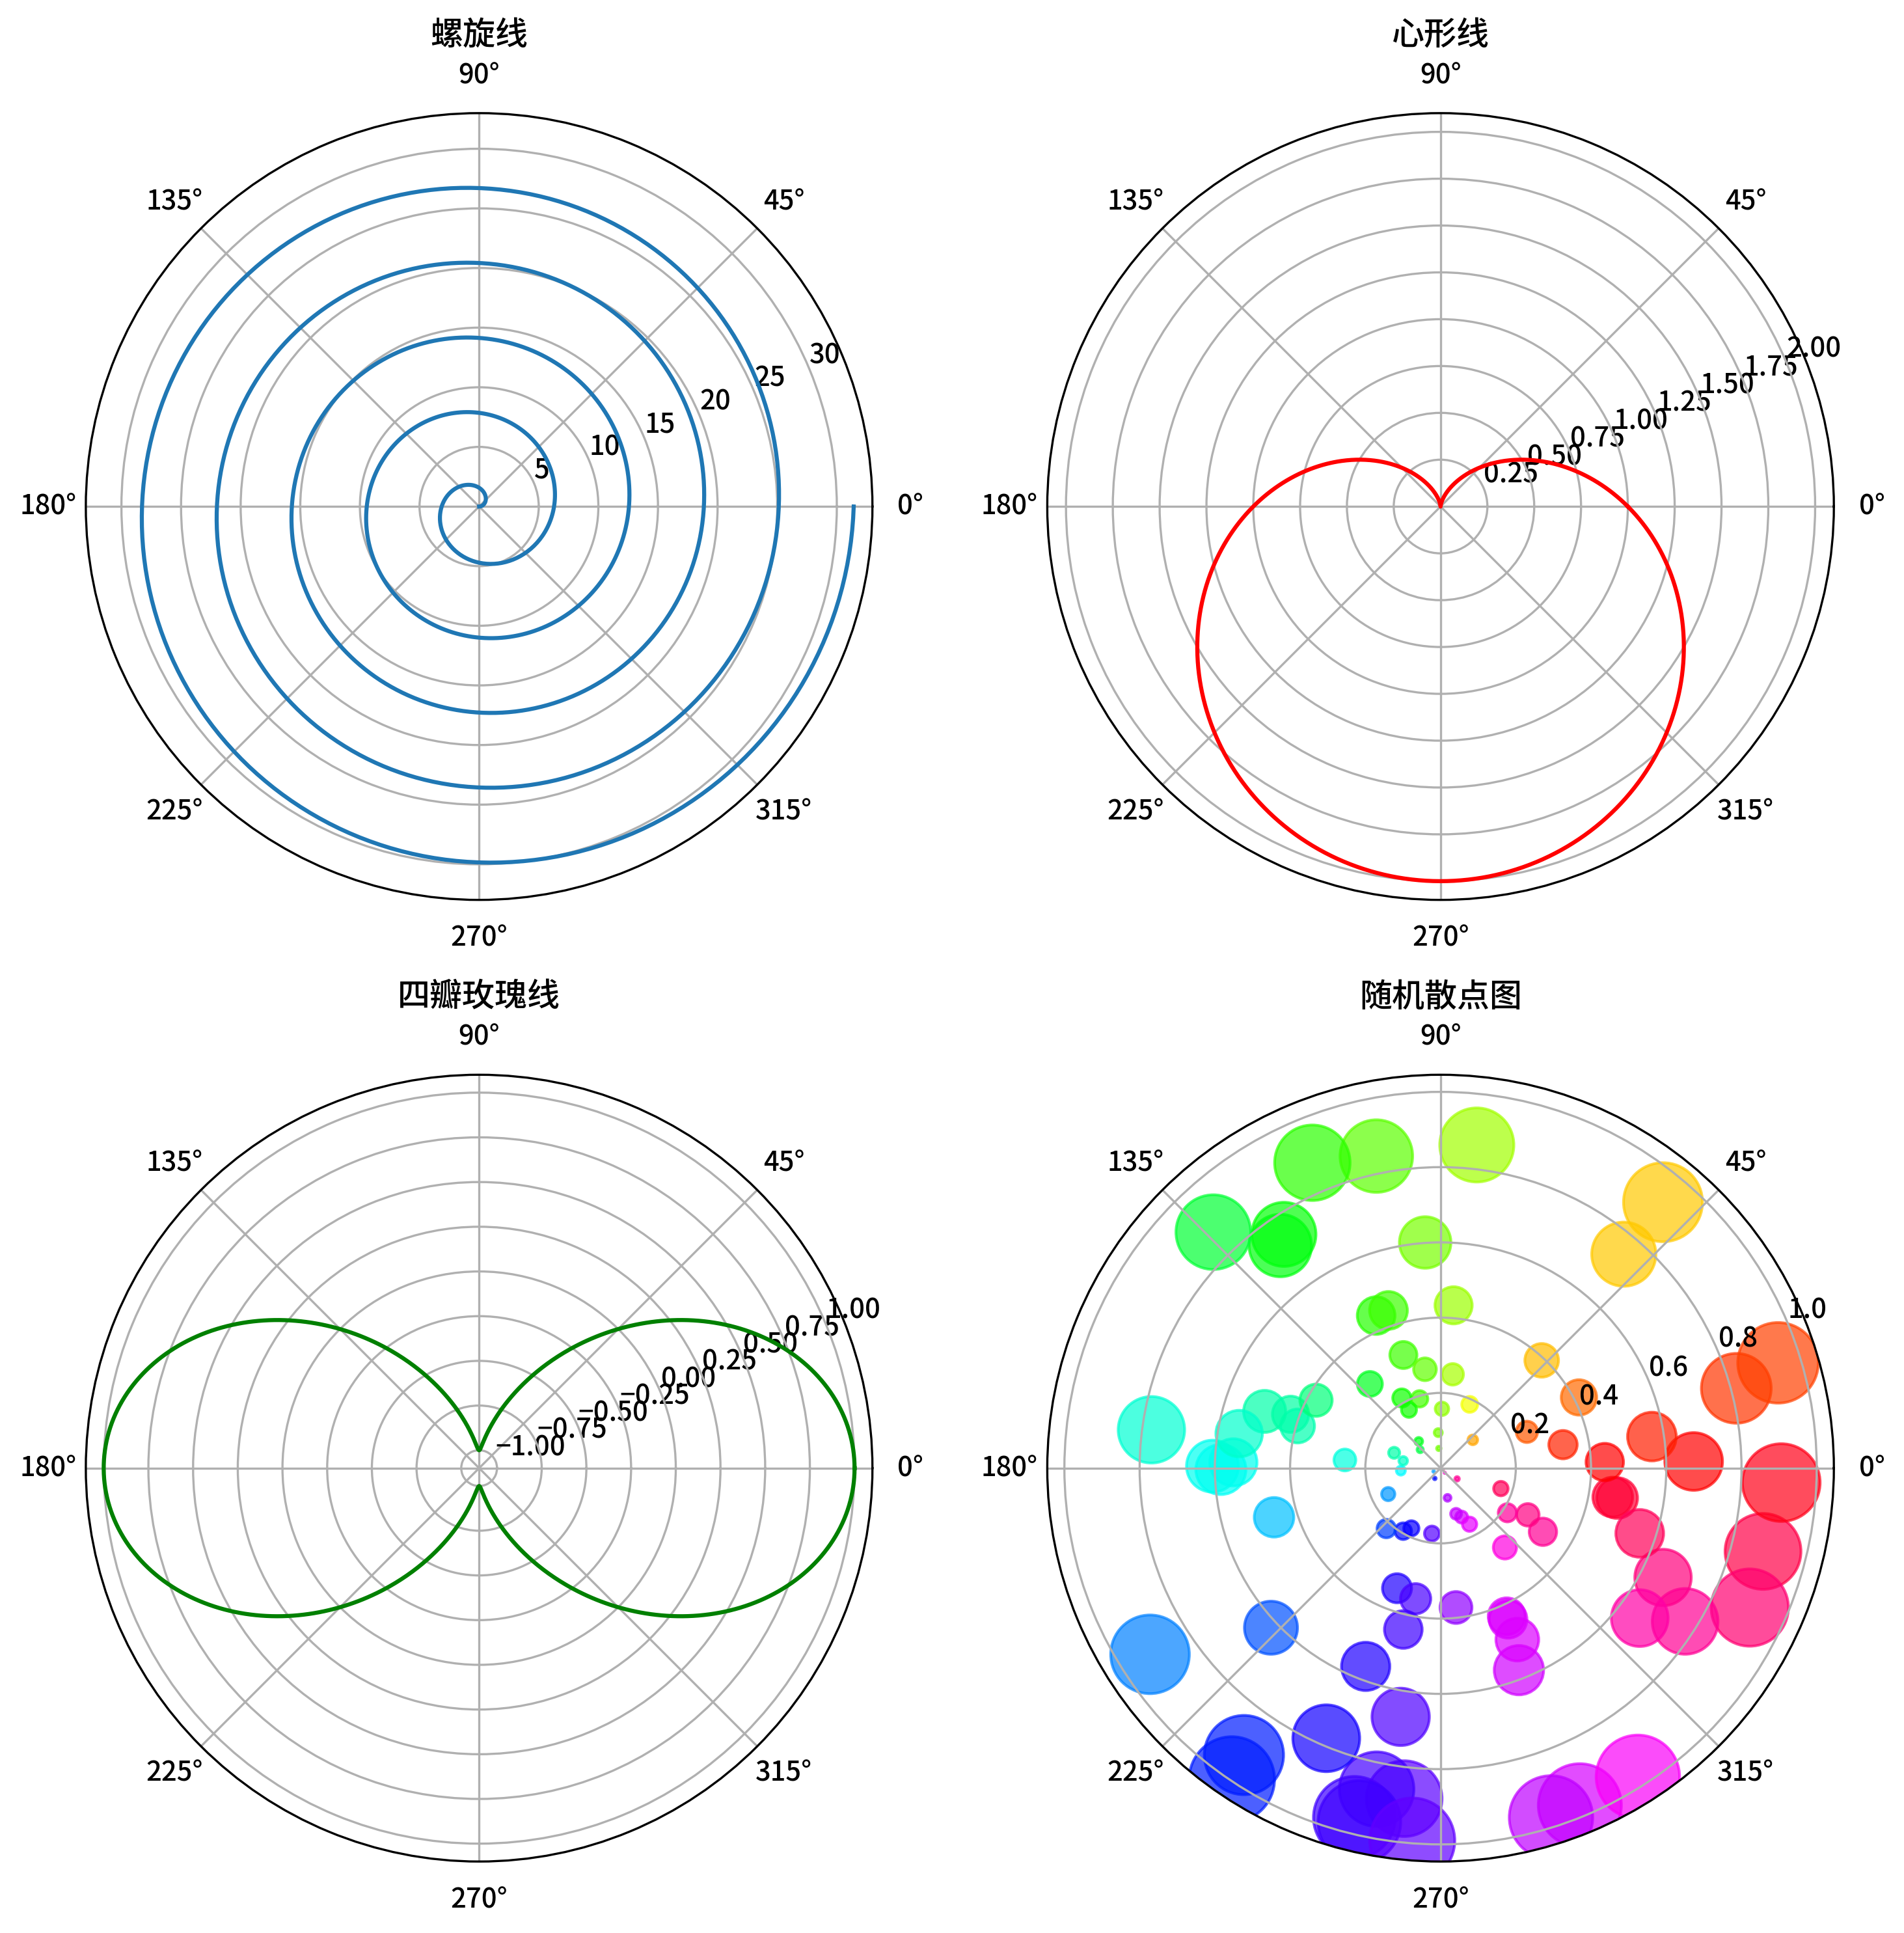
# 绘制螺旋线
theta = np.linspace(0, 10 * np.pi, 1000)
r = theta
axes[0, 0].plot(theta, r)
axes[0, 0].set_title('螺旋线')
# 绘制心形线
theta = np.linspace(0, 2 * np.pi, 1000)
r = 1 - np.sin(theta)
axes[0, 1].plot(theta, r, 'r')
axes[0, 1].set_title('心形线')
# 绘制玫瑰线 (四瓣花)
theta = np.linspace(0, 2 * np.pi, 1000)
r = np.cos(2 * theta)
axes[1, 0].plot(theta, r, 'g')
axes[1, 0].set_title('四瓣玫瑰线')
# 绘制随机散点图
theta = np.random.uniform(0, 2 * np.pi, 100)
r = np.random.uniform(0, 1, 100)
colors = theta
size = 1000 * r**2
axes[1, 1].scatter(theta, r, c=colors, s=size, cmap='hsv', alpha=0.7)
axes[1, 1].set_title('随机散点图')
# 自动调整布局
plt.tight_layout()
# 显示图形
plt.show() 结果图如下:


 被折叠的 条评论
为什么被折叠?
被折叠的 条评论
为什么被折叠?
 到【灌水乐园】发言


