


1、引入 import * as echarts from 'echarts'
2、创建图标容器
3、调用渲染
<template>
<div ref="eachrtsBox" style="width: 200px;height: 200px;"></div>
</template>
<script>
import * as echarts from 'echarts'
export default {
name: 'model',
data(){
return {
}
},
mounted(){
this.creatEchart()
this.drawShape()
},
methods:{
creatEchart(){
let dom = this.$refs.eachrtsBox
let initEcharts = echarts.init(dom)
let weekOption = {
xAxis: {
type: "category",
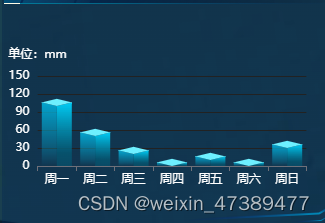
data: ["周一", "周二", "周三", "周四", "周五", "周六", "周日"],
axisLabel: {
color: "#fff",
},
},
yAxis: {
type: "value",
name: '单位:mm',
nameTextStyle: {
color: '#fff'
},
max: 150,
axisLabel: {
color: "#fff",
},
splitLine: {
lineStyle: {
color: "#222",
},
},
},
tooltip: {
trigger: "axis",
},
series: [
{
type: "custom",
name: '降雨量',
data: [100, 50, 20, 0, 10, 0, 30],
barWidth: 25,
renderItem(params, api) {
// 基础坐标
const basicsCoord = api.coord([api.value(0), api.value(1)]);
// 顶部基础 y 轴
const topBasicsYAxis = basicsCoord[1];
// 基础 x 轴
const basicsXAxis = basicsCoord[0];
// 底部 y 轴
const bottomYAxis = api.coord([api.value(0), 0])[1];
return {
type: "group",
children: [
{
type: "leftShape",
shape: {
topBasicsYAxis,
basicsXAxis,
bottomYAxis,
},
style: {
fill: new _that.graphic.LinearGradient(0, 0, 0, 1, [
{
offset: 0,
color: 'rgb(0, 192, 238,0.8)',
},
{
offset: 0.8,
color: 'rgb(0, 194, 239,0.2)',
},
{
offset: 1,
color: 'rgb(0, 194, 239,0)',
},
]),
emphasis: {
fill: 'yellow', // 鼠标高亮时的填充颜色
},
},
},
{
type: "rightShape",
shape: {
topBasicsYAxis,
basicsXAxis,
bottomYAxis,
},
style: {
fill: new echarts.graphic.LinearGradient(0, 0, 0, 1, [
{
offset: 0,
color: '#00CCF5 ',
},
{
offset: 0.8,
color: 'rgb(4, 88, 115,0.8)',
},
{
offset: 1,
color: 'rgb(4, 88, 115,0.6)',
},
]),
},
},
{
type: "topShape",
shape: {
topBasicsYAxis,
basicsXAxis,
bottomYAxis,
},
style: {
fill: new echarts.graphic.LinearGradient(0, 0, 0, 1, [
{
offset: 0.3,
color: '#6DF0FF',
},
{
offset: 1,
color: '#6DF0FF',
},
]),
},
},
],
};
}
},
],
}
initEcharts.setOption(weekOption)
},
drawShape() {
const leftShape = echarts.graphic.extendShape({
buildPath(ctx, shape) {
const { topBasicsYAxis, bottomYAxis, basicsXAxis } = shape;
// 侧面宽度
const WIDTH = 15;
// 斜角高度
const OBLIQUE_ANGLE_HEIGHT = 3.6;
const p1 = [basicsXAxis - WIDTH, topBasicsYAxis - OBLIQUE_ANGLE_HEIGHT];
const p2 = [basicsXAxis - WIDTH, bottomYAxis];
const p3 = [basicsXAxis, bottomYAxis];
const p4 = [basicsXAxis, topBasicsYAxis];
ctx.moveTo(p1[0], p1[1]);
ctx.lineTo(p2[0], p2[1]);
ctx.lineTo(p3[0], p3[1]);
ctx.lineTo(p4[0], p4[1]);
},
});
const rightShape = echarts.graphic.extendShape({
buildPath(ctx, shape) {
const { topBasicsYAxis, bottomYAxis, basicsXAxis } = shape;
// 侧面宽度
const WIDTH = 15;
// 斜角高度
const OBLIQUE_ANGLE_HEIGHT = 3.6;
const p1 = [basicsXAxis, topBasicsYAxis];
const p2 = [basicsXAxis, bottomYAxis];
const p3 = [basicsXAxis + WIDTH, bottomYAxis];
const p4 = [basicsXAxis + WIDTH, topBasicsYAxis - OBLIQUE_ANGLE_HEIGHT];
ctx.moveTo(p1[0], p1[1]);
ctx.lineTo(p2[0], p2[1]);
ctx.lineTo(p3[0], p3[1]);
ctx.lineTo(p4[0], p4[1]);
},
});
const topShape = echarts.graphic.extendShape({
buildPath(ctx, shape) {
const { topBasicsYAxis, basicsXAxis } = shape;
// 侧面宽度
const WIDTH = 15;
// 斜角高度
const OBLIQUE_ANGLE_HEIGHT = 3.6;
const p1 = [basicsXAxis, topBasicsYAxis];
const p2 = [basicsXAxis + WIDTH, topBasicsYAxis - OBLIQUE_ANGLE_HEIGHT];
const p3 = [basicsXAxis, topBasicsYAxis - OBLIQUE_ANGLE_HEIGHT * 2];
const p4 = [basicsXAxis - WIDTH, topBasicsYAxis - OBLIQUE_ANGLE_HEIGHT];
ctx.moveTo(p1[0], p1[1]);
ctx.lineTo(p2[0], p2[1]);
ctx.lineTo(p3[0], p3[1]);
ctx.lineTo(p4[0], p4[1]);
},
});
echarts.graphic.registerShape("leftShape", leftShape);
echarts.graphic.registerShape("rightShape", rightShape);
echarts.graphic.registerShape("topShape", topShape);
this.creatEchart()
},
}
}
</script>
<style lang="scss" scoped>
</style>展示效果图


 1646
1646


 被折叠的 条评论
为什么被折叠?
被折叠的 条评论
为什么被折叠?
 到【灌水乐园】发言


