library(ggplot2)
png(
filename = "diamonds-histogram.png",
type = "cairo",
res = 500,
width = 2400, height = 1800,
bg = "transparent"
)
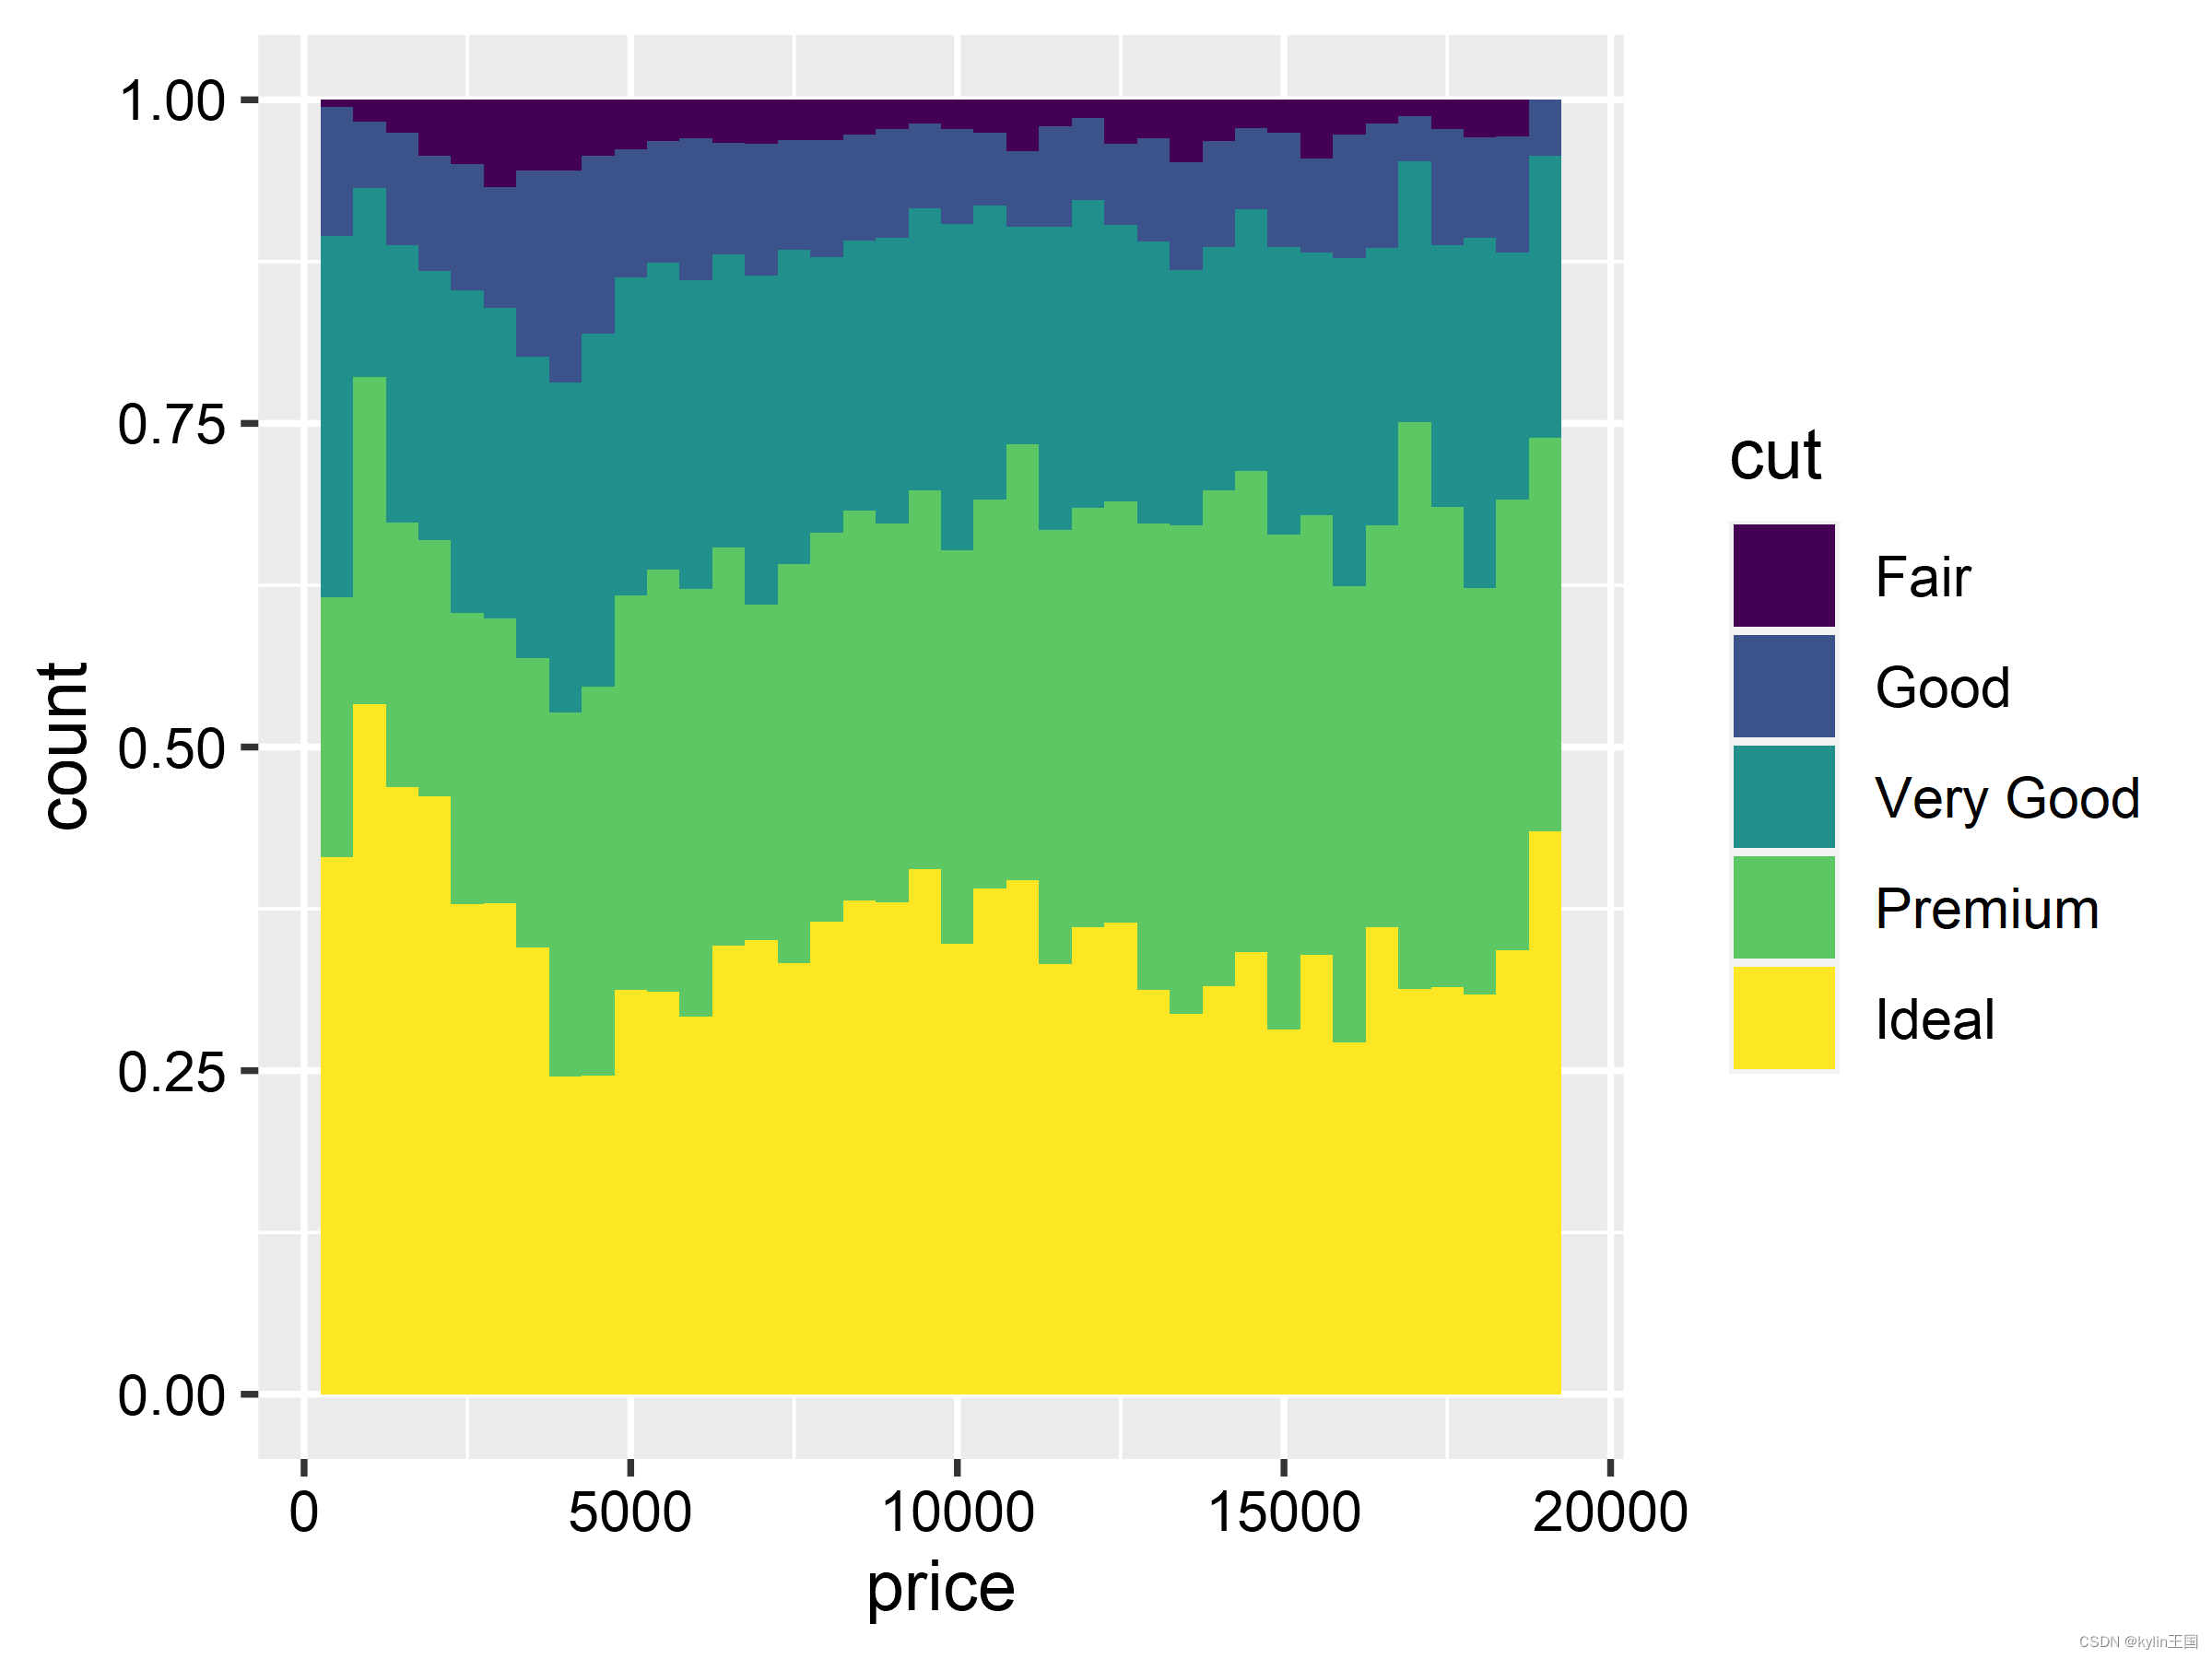
ggplot(diamonds, aes(price, fill = cut)) +
  geom_histogram(binwidth = 500, position = "fill")+
  theme(axis.text = element_text(colour = 'black'))
dev.off()
ggplot(diamonds, aes(price, fill = cut)) +
geom_histogram(binwidth = 500, position = "fill")+
theme(axis.text = element_text(colour = 'black'))
ggplot(diamonds, aes(price, fill = cut)) +
  geom_histogram(binwidth = 500, position = "fill")+
  theme(axis.text = element_text(colour = 'red'))


 475
475


 被折叠的 条评论
为什么被折叠?
被折叠的 条评论
为什么被折叠?
 到【灌水乐园】发言


