library(testpackage)
kmeans_test_data <- kmeans_test_data
kmeans_test_group <- kmeans_test_group
data <- testpackage::means_calculate(kmeans_test_data,
kmeans_test_group)
testpackage::kmeans_plot(data,
centers = 15,
row = 3,
col = 5,
center_col = "blue",
las = 2)
df <- kmeans_plot(data,
centers = 15,
row = 3,
col = 5,
center_col = "blue",
las = 2)
library(reshape2)
df2 <- melt(df)
ggplot(df2[which(df2$Cluster == 'cluster2'),],
aes(x = variable,
y = value,
group =meta ))+
geom_line()
plot_list = list()
for (i in 1:15) {
p <- ggplot(df2[which(df2$Cluster == paste0('cluster',i)),],
aes(x = variable,
y = value,
group =meta ))+
geom_line(col = "blue")+
labs(x= "xlab",y = "ylab")+
theme_bw()
plot_list[[i]] = p
}
plot_list[1]
plot_list[2]
plot_list[3]
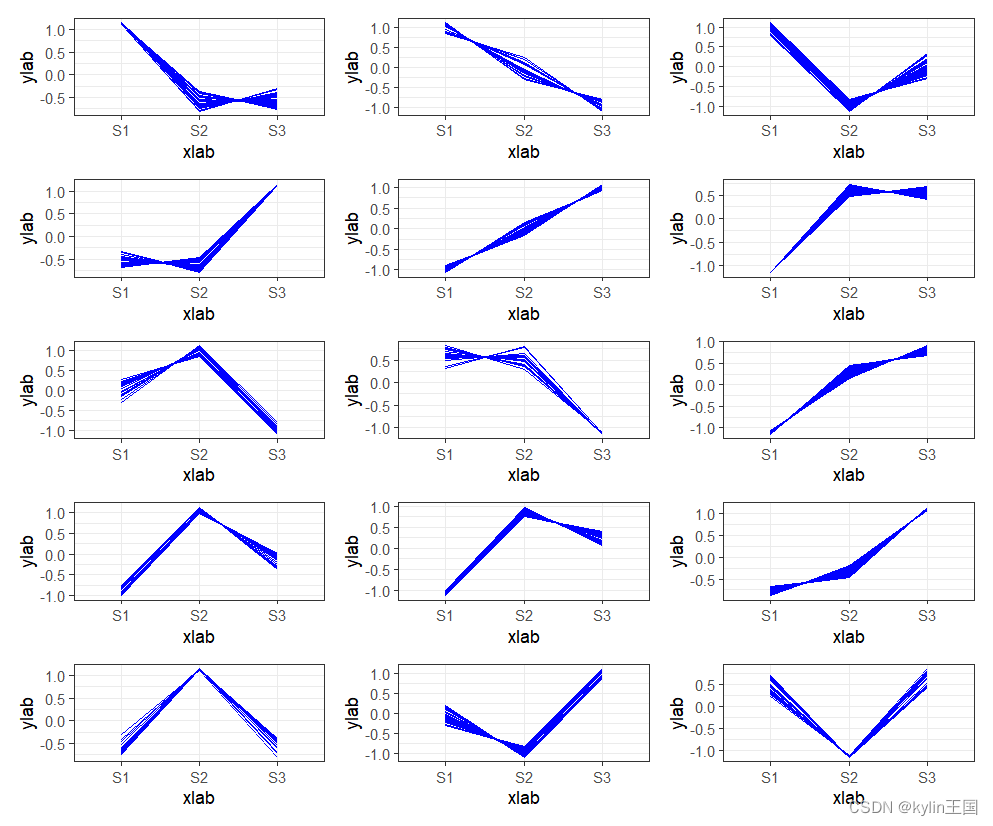
library(patchwork)
wrap_plots(plot_list, byrow = T, nrow = 5)
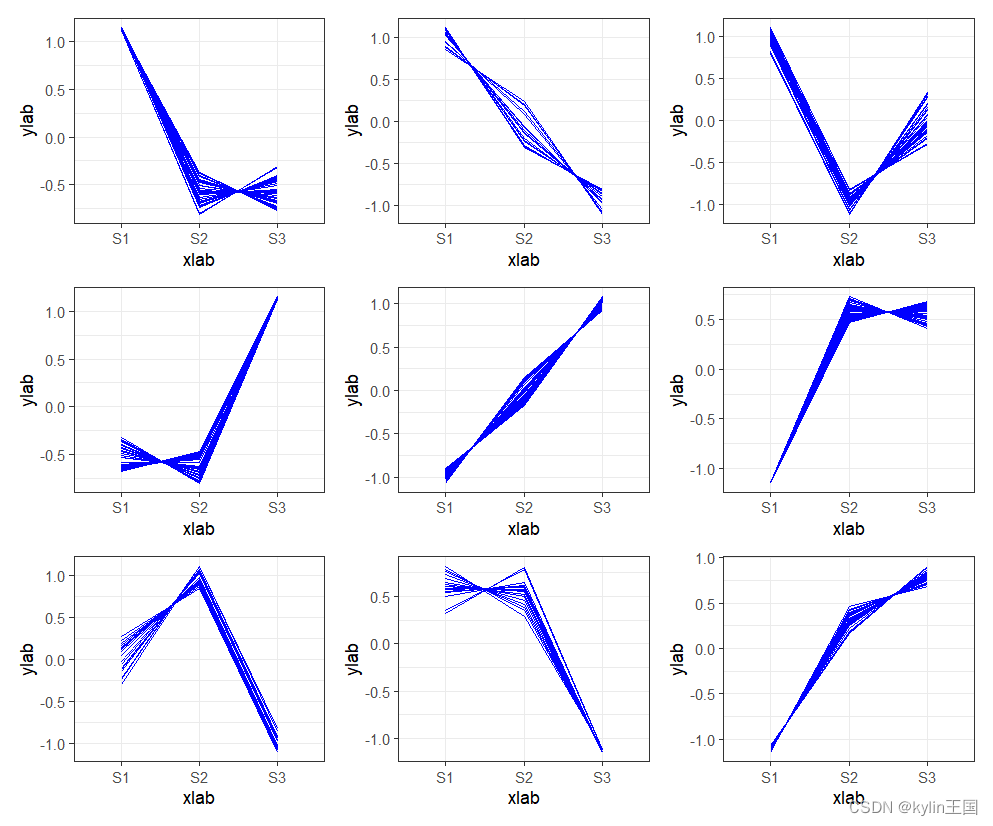
library(cowplot)
plot_grid(plotlist = plot_list, align = "h",
nrow = 3)
for (i in 1:15) {
  assign(paste("p",i,sep=""),ggplot(df2[which(df2$Cluster == paste0('cluster',i)),],
                                    aes(x = variable,
                                        y = value,
                                        group =meta ))+
           geom_line(col = "blue")+
           labs(x= "xlab",y = "ylab")+
           theme_bw())
}


p1+p2+p3+p4+p5+p6+p7+p8+p9


 1325
1325


 被折叠的 条评论
为什么被折叠?
被折叠的 条评论
为什么被折叠?
 到【灌水乐园】发言


