


实现效果图:具体参考echarts的文档
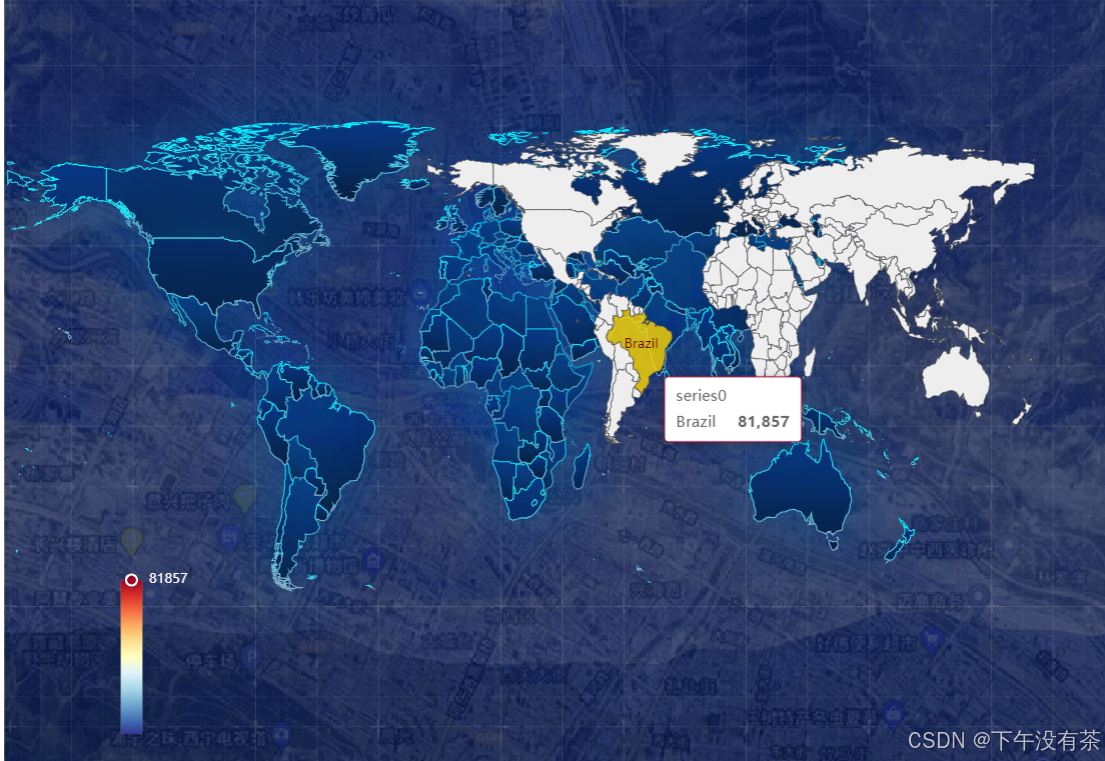
需要解决的问题:
因为世界地图的json数据,一开始看文档没找到,最后把请求接口改成了请求world,居然拿到了数据,直接导出这个world.json
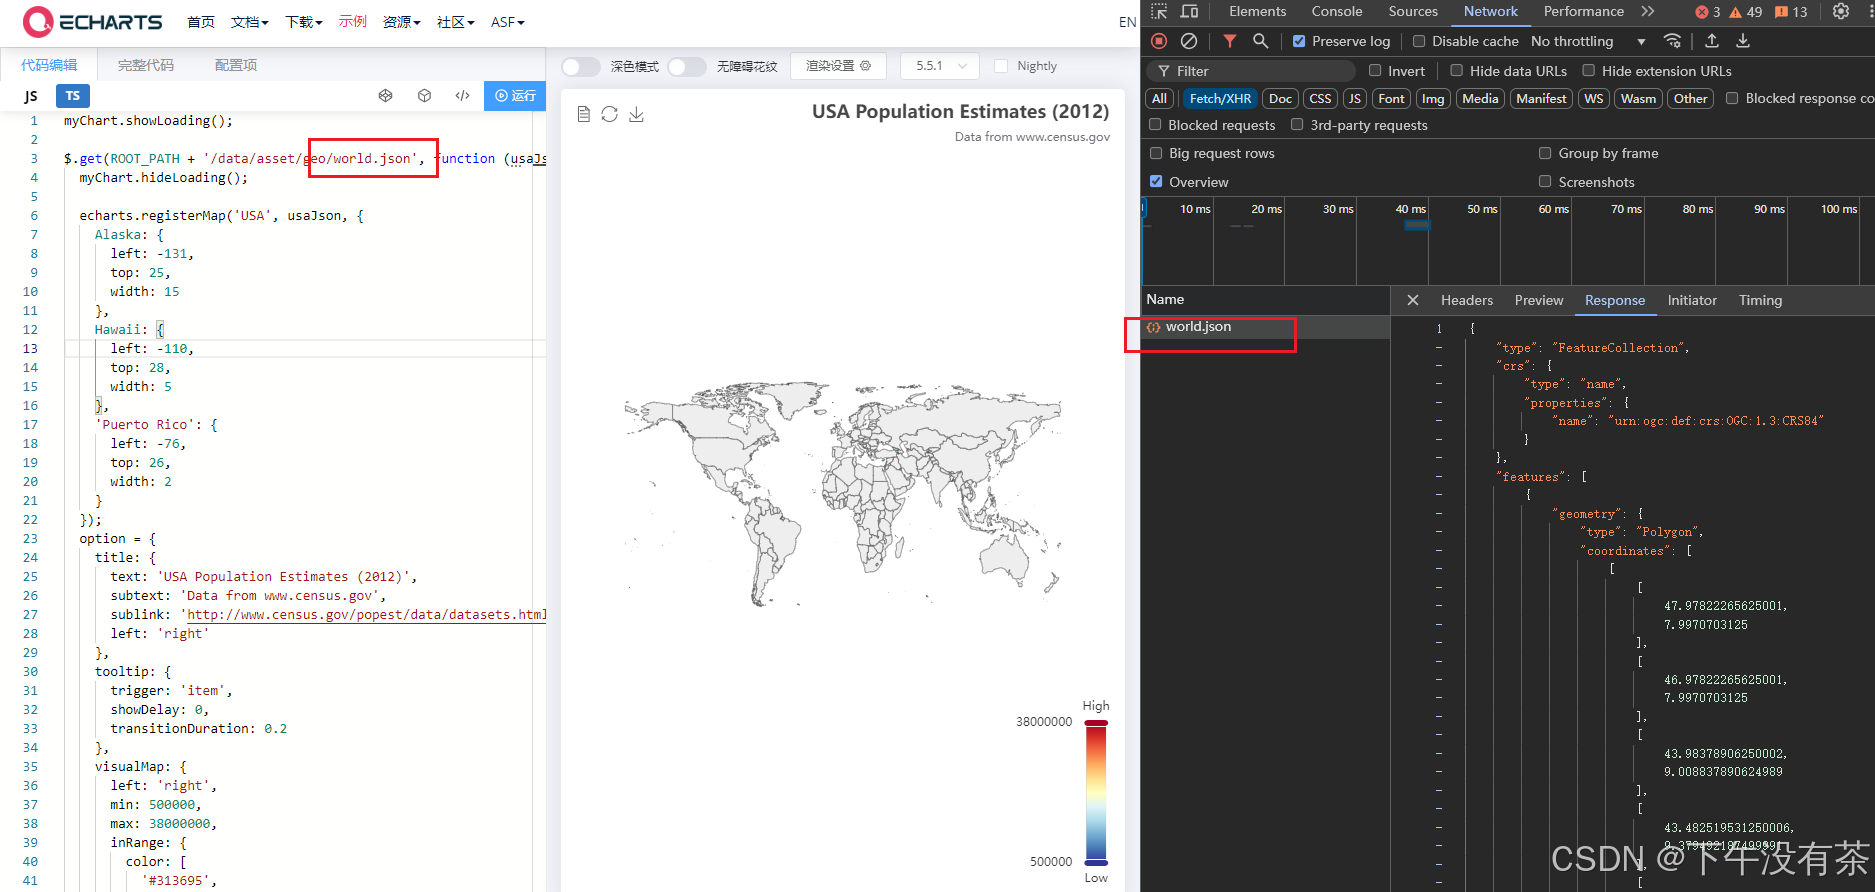
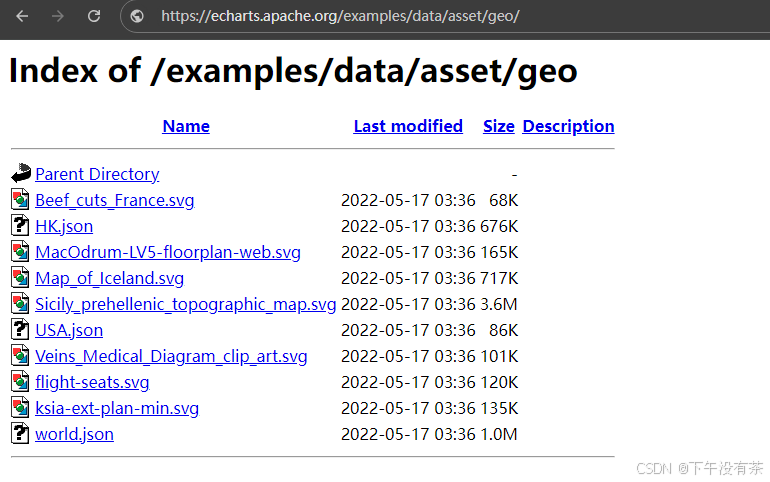
Index of /examples/data/asset/geo 这是echarts提供的geojson数据的目录
具体实现方法:
<script setup lang="ts">
// 导入echarts核心模块
import * as echarts from 'echarts/core';
// 导入echarts组件模块
import {
  TitleComponent,
  ToolboxComponent,
  TooltipComponent,
  VisualMapComponent,
  GeoComponent,
  type TooltipComponentOption,
  type VisualMapComponentOption,
  type ToolboxComponentOption,
  type TitleComponentOption,
  type GeoComponentOption,
} from 'echarts/components';
// 导入地图图表模块
import { MapChart, type MapSeriesOption } from 'echarts/charts';
// 导入Canvas渲染器模块
import { CanvasRenderer } from 'echarts/renderers';

// 使用echarts模块
echarts.use([
  TitleComponent,
  ToolboxComponent,
  TooltipComponent,
  VisualMapComponent,
  GeoComponent,
  MapChart,
  CanvasRenderer,
]);

// 定义ECharts配置类型
type EChartsOption = echarts.ComposeOption<
  | TitleComponentOption
  | ToolboxComponentOption
  | TooltipComponentOption
  | VisualMapComponentOption
  | GeoComponentOption
  | MapSeriesOption
>;
// 导入世界地图JSON数据
import mapJson from './world.json';
// 在组件挂载后执行
onMounted(() => {
  // 定义ECharts配置项
  const option: EChartsOption = {
    tooltip: {
      trigger: 'item',
    },
    grid: {
      left: '0px',
      right: '80px',
      top: '10px',
      bottom: '10px',
    },

    geo: {
      map: 'world',
      zoom: 1.5,
      center: [102.848234, 32.82333],
      // 设置地图的缩放限制
      scaleLimit: {
        min: 0.8,
      },
      // 设置地图标签的样式
      label: {
        // color: '#fdfdfd', // 文字颜色
        // show: true,
        // fontSize: 8,
      },
      // 设置地图高亮状态下的样式
      emphasis: {
        label: {
          color: '#fff',
          show: true,
        },
        itemStyle: {
          areaColor: {
            x: 0,
            y: 0,
            x2: 0,
            y2: 1,
            colorStops: [
              { offset: 0, color: '#073684' },
              { offset: 1, color: '#2B91B7' },
            ],
          },
        },
      },
      roam: true, // 启用自由缩放和平移功能
      // 设置地图的样式
      itemStyle: {
        areaColor: {
          x: 0,
          y: 0,
          x2: 0,
          y2: 1,
          colorStops: [
            { offset: 0, color: '#073684' },
            { offset: 1, color: '#061E3D' },
          ],
        },
        borderColor: new echarts.graphic.LinearGradient(
          0,
          0,
          0,
          1,
          [
            { offset: 0, color: '#00F6FF' },
            { offset: 1, color: '#87ADCB' },
          ],
          false,
        ),
        shadowColor: 'rgba(10,76,139,1)',
        shadowOffsetY: 0,
        shadowBlur: 60,
        borderWidth: 1,
      },
      // tooltip: {
      //   show: false,
      // },
    },
    //视觉映射配置
    visualMap: {
      left: '10%',
      bottom: '10%',
      min: 1000,
      max: 20000,
      inRange: {
        color: [
          '#313695',
          '#4575b4',
          '#74add1',
          '#abd9e9',
          '#e0f3f8',
          '#ffffbf',
          '#fee090',
          '#fdae61',
          '#f46d43',
          '#d73027',
          '#a50026',
        ],
      },
      textStyle: {
        color: '#fff',
      },
    },
    series: [
      {
        type: 'map',
        roam: true,
        map: 'world',
        emphasis: {
          label: {
            show: true,
          },
        },
        data: [
          { name: 'Virginia', value: 81857 },
          { name: 'Brazil', value: 81857 },
          { name: 'Washington', value: 612 },
          { name: 'West Virginia', value: 55413 },
          { name: 'Wisconsin', value: 57268 },
          { name: 'Wyoming', value: 5762 },
          { name: 'Puerto Rico', value: 67084 },
        ],
      },
    ],
  };
  // 注册自定义地图
  echarts.registerMap(
    'world',
    mapJson as unknown as Parameters<typeof echarts.registerMap>[1],
  );
  // 获取图表容器
  let chartDom = document.getElementById('mapChart');
  // 初始化图表
  let myChart = echarts.init(chartDom);
  // 设置图表配置项
  myChart.setOption(option);
});
</script>
<template>
  <!-- 图表容器 -->
  <div id="mapChart"></div>
</template>

<style scoped lang="scss">
#mapChart {
  width: 100%;
  height: 100%;
  background: url('@/assets/image/deep-bg.png') no-repeat;
}
</style>
补充:如何获取GeoJson数据
国内:【阿里可视化平台】可以获取国内各个省市地区的geojson数据
国外:【Vector Maps】可以获取所以国家的geojson数据


 385
385

 被折叠的 条评论
为什么被折叠?
被折叠的 条评论
为什么被折叠?
 到【灌水乐园】发言


