


 本文档介绍如何使用 Echarts 创建甘特图,包括UI设计、展示效果及所需的数据结构。案例中提到了三种不同颜色的柱子表示不同状态,并探讨了在自定义系列中修改柱子上文案的挑战。
<template>
  <div class="pwgh-card">
    <div class="chart" ref="chart"></div>
  </div>
</template>
<script>
import { mapActions, mapState, mapGetters } from 'vuex'
import { chunk, slice } from 'lodash'

import * as echarts from 'echarts'

export default {
  name: 'LinesCard',
  props: ['list', 'deptType'],
  data() {
    return {}
  },
  created() {},
  mounted() {
    this.initChart()
    this.refreshChart()
  },
  watch: {
    list() {
      this.initChart()
      this.refreshChart()
    },
    theme() {
      this.initChart()
      this.refreshChart()
    },
  },
  computed: {
    ...mapState(['theme']),
  },
  methods: {
    initChart() {
      echarts.registerTheme('light', {
        color: ['#19D4AE', '#D9D9D9'],
        title: {
          textStyle: {
            color: '#464646',
          },
        },
        legend: {
          textStyle: {
            color: '#4D4D4D',
          },
        },
        categoryAxis: {
          axisLabel: {
            show: true,
            color: '#4D4D4D',
          },
        },
        valueAxis: {
          axisLabel: {
            show: true,
            color: '#4D4D4D',
          },
        },
        line: {
          itemStyle: {
            color: '#5AB1EF',
          },
          areaStyle: {
            color: new echarts.graphic.LinearGradient(0, 1, 0, 0, [
              {
                offset: 0,
                color: 'rgba(128, 186, 231, 0)',
              },
              {
                offset: 1,
                color: 'rgba(90, 177, 239, 0.76)',
              },
            ]),
          },
        },
      })
      echarts.registerTheme('green', {
        color: ['#19D4AE', '#D9D9D9'],
        title: {
          textStyle: {
            color: '#fff',
          },
        },
        legend: {
          textStyle: {
            color: '#fff',
          },
        },
        categoryAxis: {
          axisLabel: {
            show: true,
            color: '#fff',
          },
        },
        valueAxis: {
          axisLabel: {
            show: true,
            color: '#fff',
          },
          nameTextStyle: {
            color: '#fff',
          },
        },
        bar: {
          itemStyle: {
            // color: 'rgba(118, 201, 85, 1)'
          },
          label: {
            // show: true,
            color: '#fff',
          },
        },
        line: {
          itemStyle: {
            color: 'rgba(118, 201, 85, 1)',
          },
          label: {
            // show: true,
            color: '#fff',
          },
          areaStyle: {
            color: new echarts.graphic.LinearGradient(0, 1, 0, 0, [
              {
                offset: 0,
                color: 'rgba(118, 201, 85, 0)',
              },
              {
                offset: 1,
                color: 'rgba(118, 201, 85, 1)',
              },
            ]),
          },
        },
      })
      echarts.registerTheme('blue', {
        color: ['#19D4AE', '#D9D9D9'],
        title: {
          textStyle: {
            color: '#fff',
          },
        },
        legend: {
          textStyle: {
            color: '#fff',
          },
        },
        categoryAxis: {
          axisLabel: {
            show: true,
            color: '#fff',
          },
        },
        valueAxis: {
          axisLabel: {
            show: true,
            color: '#fff',
          },
          nameTextStyle: {
            color: '#fff',
          },
        },
        line: {
          itemStyle: {
            color: 'rgba(90, 177, 239, 1)',
          },
          label: {
            // show: true,
            color: '#fff',
          },
          areaStyle: {
            color: new echarts.graphic.LinearGradient(0, 1, 0, 0, [
              {
                offset: 0,
                color: 'rgba(128, 186, 231, 0)',
              },
              {
                offset: 1,
                color: 'rgba(90, 177, 239, 0.76)',
              },
            ]),
          },
        },
        bar: {
          itemStyle: {
            // color: 'rgba(90, 177, 239, 1)'
          },
          label: {
            // show: true,
            color: '#fff',
          },
        },
      })

      this.chart?.dispose()
      this.chart = echarts.init(this.$refs.chart, this.theme)
    },
    refreshChart() {
      this.chart?.clear()
      var that = this
      let xData = []
      let yData1 = []
      let yData2 = []
      let yData3 = []
      // data = [
      //   [0, '2021-1-21 14:48:08', '2021-2-21 14:48:19', '#cecece'],
      //   [0, '2021-2-23 14:48:19', '2021-3-28 14:51:49', '#dddece'],
      //   [1, '2021-2-21 14:54:13', '2021-10-21 14:54:26', '#ddfece'],
      //   [1, '2021-11-21 14:54:26', '2021-12-21 14:54:47', '#dddece'],
      //   [2, '2021-3-21 14:54:47', '2021-6-21 15:01:26', '#dddece'],
      //   [2, '2021-9-21 15:01:26', '2021-12-21 15:03:26', '#dddece'],
      //   [3, '2021-9-21 15:01:26', '2021-12-21 15:03:26', '#dddece'],
      //   [4, '2021-9-21 15:01:26', '2021-12-21 15:03:26', '#dddece'],
      // ],

      xData = this.list.map(item => item.deptName)
      this.list.map(item => {
        yData1.push([item.deptName, item.startTime, item.endTime, '截止', '#C4C4C4'])

        if (new Date(item.maxTaskCompleteTime) > new Date(item.endTime)) {
          // 有超期
          yData1.push([item.deptName, item.endTime, item.maxTaskCompleteTime, '超期', '#FF9601'])
        }
        item.taskCompleteList?.map((el, elIndex, arr) => {
          if (el.completeTime) {
            // 没超期的绿色点
            if (new Date(el.completeTime) < new Date(item.endTime)) {
              // 没超期的点就显示绿柱
              yData1.push([item.deptName, item.startTime, el.completeTime, '', '#42CC07'])
              yData2.push([el.completeTime, item.deptName, el.taskNodeCode, ((elIndex+1)*100/arr.length).toFixed(2)])
            } else {
              yData3.push([el.completeTime, item.deptName, el.taskNodeCode, ((elIndex+1)*100/arr.length).toFixed(2)])
            }
          }
        })
      })
      // console.log(yData1, yData2, yData3, 'yData')

      let option = {
        tooltip: {
          // trigger: 'axis',
          axisPointer: {
            type: 'shadow',
          },
          formatter: function (params) {
            // console.log(params, '====')
            let valstr = ''
            if (params.seriesIndex === 0) {
              valstr =
                '<div>' +
                params.marker +
                params.name +
                `<div>${params.value[3] === '超期' ? '截止时间' : '开始时间'} : ` +
                params.value[1] +
                `<div>${params.value[3] === '超期' ? '超期时间' : '截止时间'} : ` +
                params.value[2]
            }
            if (params.seriesIndex === 1) {
              valstr =
                '<div>' +
                params.marker +
                params.name +
                `<div>${params.value[2] ? '完成阶段' + params.value[2] : '完成时间'} : ${
                  params.value[0]
                }` +
                `${params.value[2] ? '' : '<div>完成量 : ' + params.value[3]+'%' }`
            }
            if (params.seriesIndex === 2) {
              valstr =
                '<div>' +
                params.marker +
                params.name +
                `<div>${params.value[2] ? '完成阶段' + params.value[2] : '完成时间'} : ${
                  params.value[0]
                }` +
                `${params.value[2] ? '' : '<div>完成量 : ' + params.value[3]+'%' }`
            }
            return valstr
          },
        },
        grid: {
          top: 50,
          bottom: 40,
          right: 60,
          left: 60,
        },
        xAxis: {
          type: 'time',
          position: 'top',
          splitLine: {
            show: true,
            lineStyle: {
              color: 'rgba(183, 183, 183, 0.20)',
            },
          },
          axisLabel: {
            // color: '#7E7E7E',
            fontSize: '12',
            formatter: '{yyyy}-{MM}-{dd}',
          },
          // axisPointer: {
          //   show: true,
          //   label: {
          //     formatter: function (params) {
          //       let a = parseInt(params.value)
          //       return new Date(a).toLocaleString()
          //     },
          //     color: 'black',
          //   },
          // },
        },
        dataZoom: [
          {
            type: 'slider',
            start: 0,
            minSpan: 1,
            width: '80%',
            bottom: 16,
            height: 14,
            left: 'center',
          },
          {
            type: 'slider',
            show: true,
            yAxisIndex: [0],
            right: '0%',
            start: 0,
            end: 50,
          },
        ],
        yAxis: {
          type: 'category',
          data: xData,
          axisLine: {
            show: false,
          },
          axisTick: {
            show: false,
          },
          axisLabel: {
            inside: false,
            // color: '#4d4d4d',
            fontSize: 12,
            interval: '0',
            align: 'center',
            padding: [0, 30, 0, 0],
            formatter: function (value, index) {
              // let value = '都是负担放到沙发的'
              let vl = value.length
              if (vl <= 4) {
                return value
              } else if (vl > 4 && vl <= 8) {
                let arr = []
                for (let i = 0; i < vl; i += 4) {
                  arr.push(value.slice(i, i + 4))
                }
                return arr[0] + '\n' + arr[1] + ''
              } else if (vl > 4 && vl > 8) {
                let arr = []
                for (let i = 0; i < vl; i += 4) {
                  arr.push(value.slice(i, i + 4))
                }
                return arr[0] + '\n' + [...arr[1]][0] + [...arr[1]][1] + [...arr[1]][2] + '...'
              }
            },
          },
        },
        series: [
          {
            type: 'custom',
            encode: { x: [1, 2], y: 0 },
            itemStyle: {
              normal: {
                // color: '#7b9ce1',
              },
            },
            // labelLayout(params) {
            //   return {
            //     x: params.rect.x + 10,
            //     y: params.rect.y + params.rect.height,
            //   }
            // },
            data: yData1,
            renderItem: function (params, api) {
              var categoryIndex = api.value(0)
              var start = api.coord([api.value(1), categoryIndex])
              var end = api.coord([api.value(2), categoryIndex])
              var height =
                that.deptType > 2 ? api.size([0, 1])[1] * 0.05 : api.size([0, 1])[1] * 0.4
              var beginY = start[1] - height / 2
              var customItemStyle = api.style()
              customItemStyle['text'] = api.value(3)
              customItemStyle['textFill'] = '#222'
              customItemStyle['textStrokeWidth'] = 0
              customItemStyle['textPosition'] = 'insideRight'
              customItemStyle['fill'] = api.value(4)
              return {
                type: 'rect',
                shape: echarts.graphic.clipRectByRect(
                  {
                    x: start[0],
                    y: beginY,
                    width: end[0] - start[0],
                    height: height,
                  },
                  {
                    x: params.coordSys.x,
                    y: params.coordSys.y,
                    width: params.coordSys.width,
                    height: params.coordSys.height,
                  }
                ),
                style: customItemStyle,
              }
            },
          },
          {
            name: '进行中',
            type: 'scatter',
            symbolSize: 20,
            itemStyle: {
              normal: {
                borderColor: '#fff',
                borderWidth: 2,
                color: '#42CC07',
                opacity: 1,
              },
            },
            data: yData2
          },
          {
            name: '超期',
            type: 'scatter',
            symbolSize: 20,
            itemStyle: {
              normal: {
                borderColor: '#fff',
                borderWidth: 2,
                color: '#FF9601',
                opacity: 1,
              },
            },
            data: yData3
          },
        ],
      }

      // this.dom = echarts.init(this.$refs.dom)
      this.chart.setOption(option)
      var that = this

      setTimeout(() => {
        window.addEventListener('resize', function () {
          that.chart.resize()
        })
      }, 200)
    },
  },
}
</script>
<style lang="less" scoped>
.pwgh-card {
  width: 100%;
  height: 100%;
  box-sizing: border-box;
  // padding: 0 12px;
  .chart {
    width: 100%;
    height: 100%;
  }
}
</style>
UI图
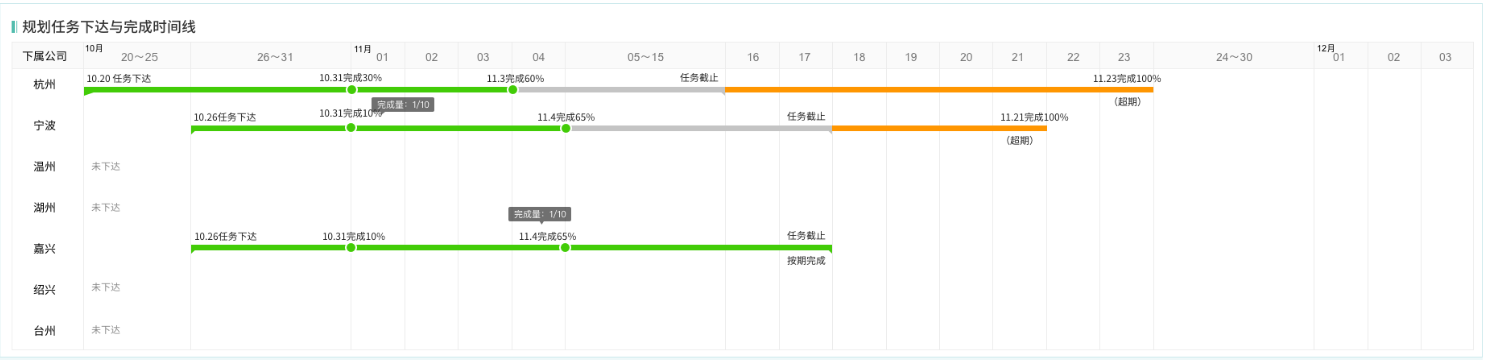
效果
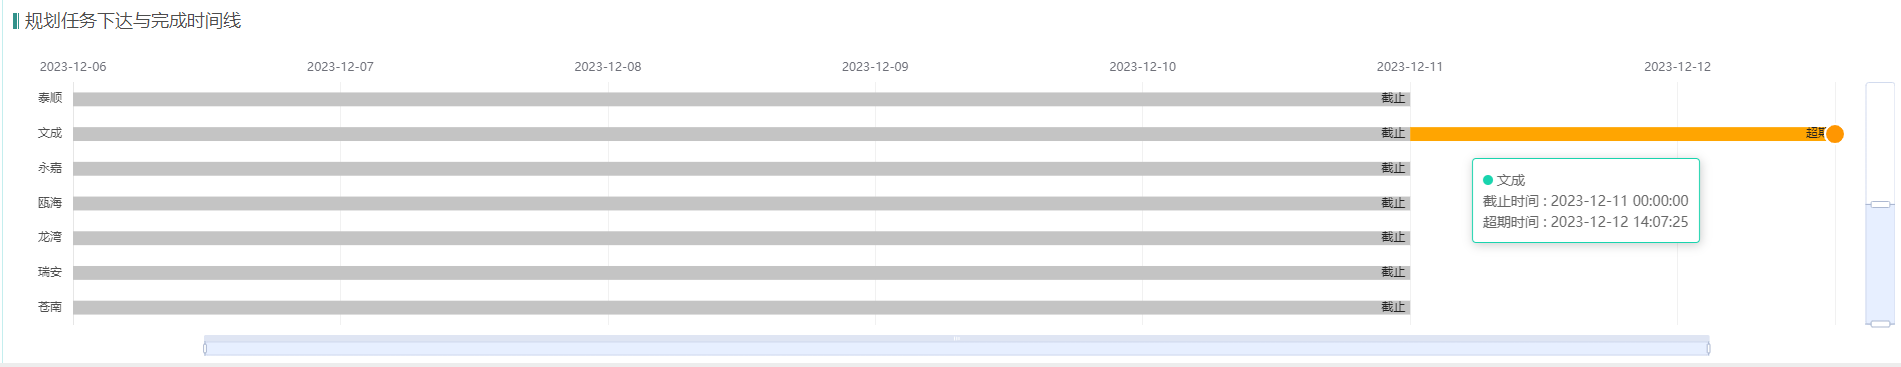
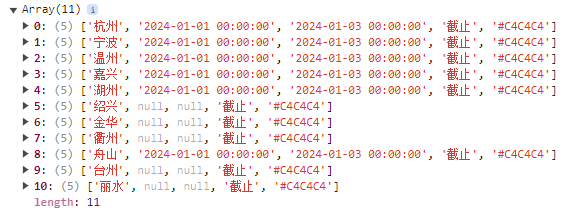
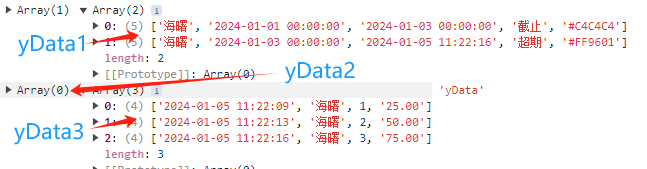
数据结构
yData1:柱子长度时间(包括灰色、绿色、橘色三种柱子)
[y轴,开始时间,结束时间,状态文案,柱子颜色]
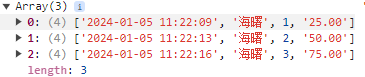
yData2:未超期的点(完成进度)–绿色
yData3:超期的点 --橘色
[x轴时间,y轴,进度阶段(业务功能,可没有),进度百分比(业务功能,可没有)]
案例
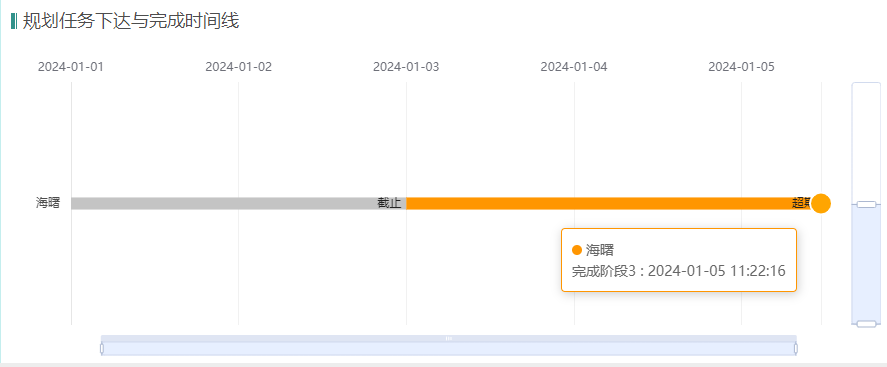
缺陷: 柱子上文案不好修改自定义位置,知道的可以评论教下我(因为在自定义的series中)


 被折叠的 条评论
为什么被折叠?
被折叠的 条评论
为什么被折叠?
 到【灌水乐园】发言


