


书接上回:
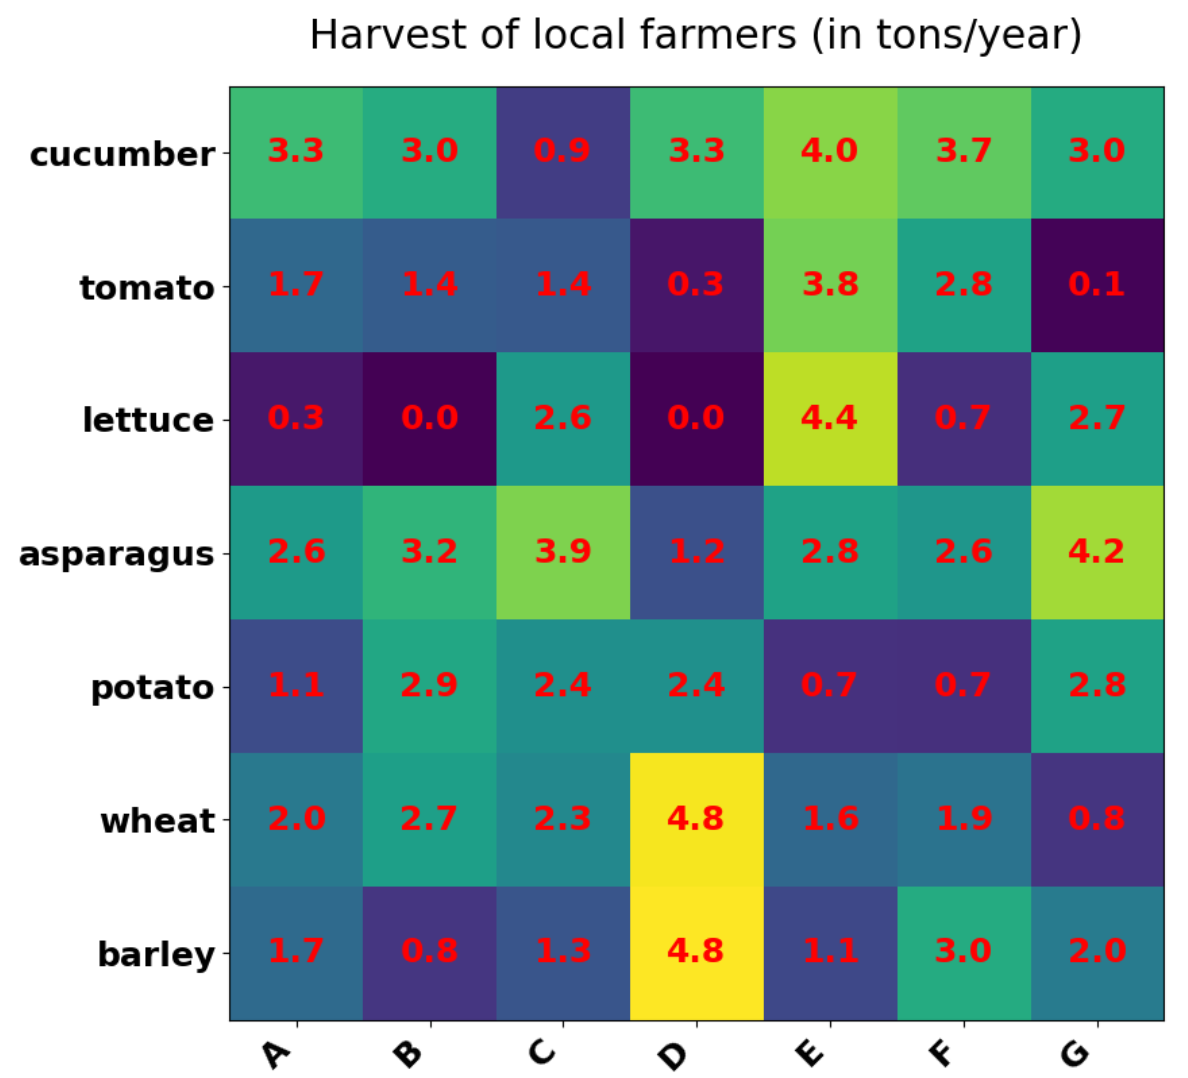
热力图
import numpy as np
import matplotlib
import matplotlib.pyplot as plt
vegetables = ["cucumber", "tomato", "lettuce", "asparagus","potato", "wheat",
"barley"]
farmers = list('ABCDEFG')

harvest = np.random.rand(7,7)*5 # 农民丰收数据

plt.rcParams['font.size'] = 18
plt.rcParams['font.weight'] = 'heavy'
plt.figure(figsize=(9,9))
im = plt.imshow(harvest)

plt.xticks(np.arange(len(farmers)),farmers,rotation = 45,ha = 'right')
plt.yticks(np.arange(len(vegetables)),vegetables)

# 绘制文本
for i in range(len(vegetables)):
    for j in range(len(farmers)):
        text = plt.text(j, i, round(harvest[i, j],1),
                        ha="center", va="center", color='r')
plt.title("Harvest of local farmers (in tons/year)",pad = 20)
plt.tight_layout()
plt.savefig('./热力图.png')
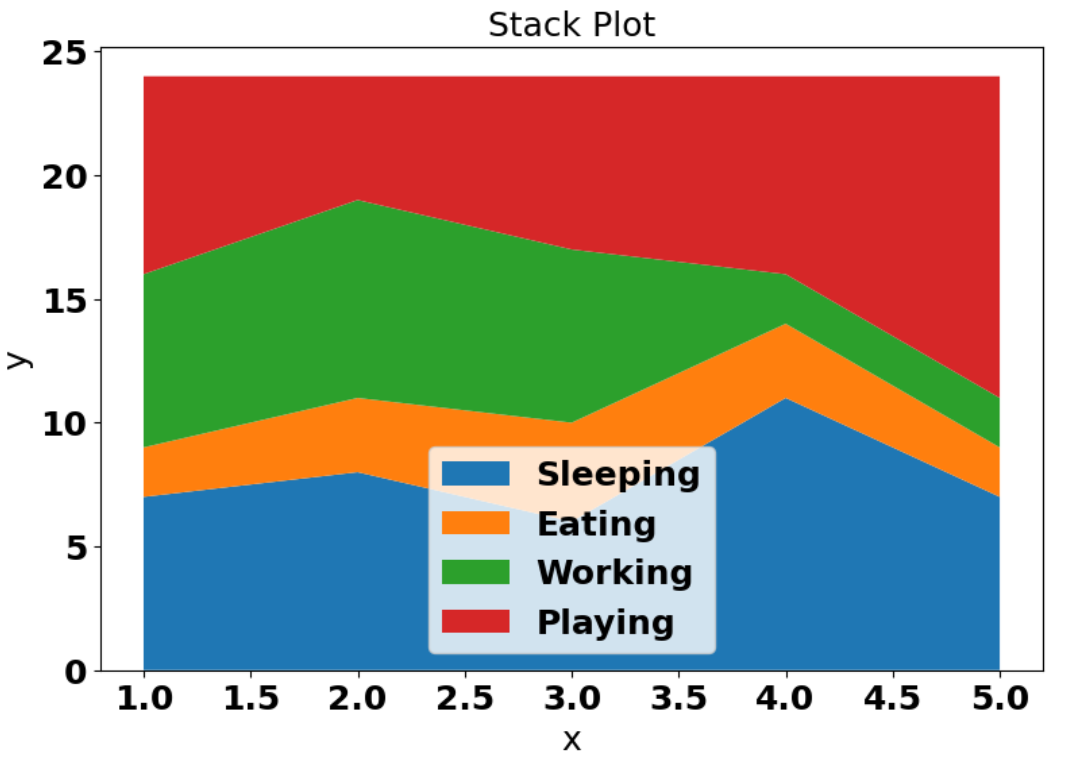
面积图
import matplotlib.pyplot as plt
plt.figure(figsize=(9,6))
days = [1,2,3,4,5]
sleeping =[7,8,6,11,7]
eating = [2,3,4,3,2]
working =[7,8,7,2,2]
playing = [8,5,7,8,13]
plt.stackplot(days,sleeping,eating,working,playing)
plt.xlabel('x')
plt.ylabel('y')
plt.title('Stack Plot',fontsize = 18)
plt.legend(['Sleeping','Eating','Working','Playing'],fontsize = 18)
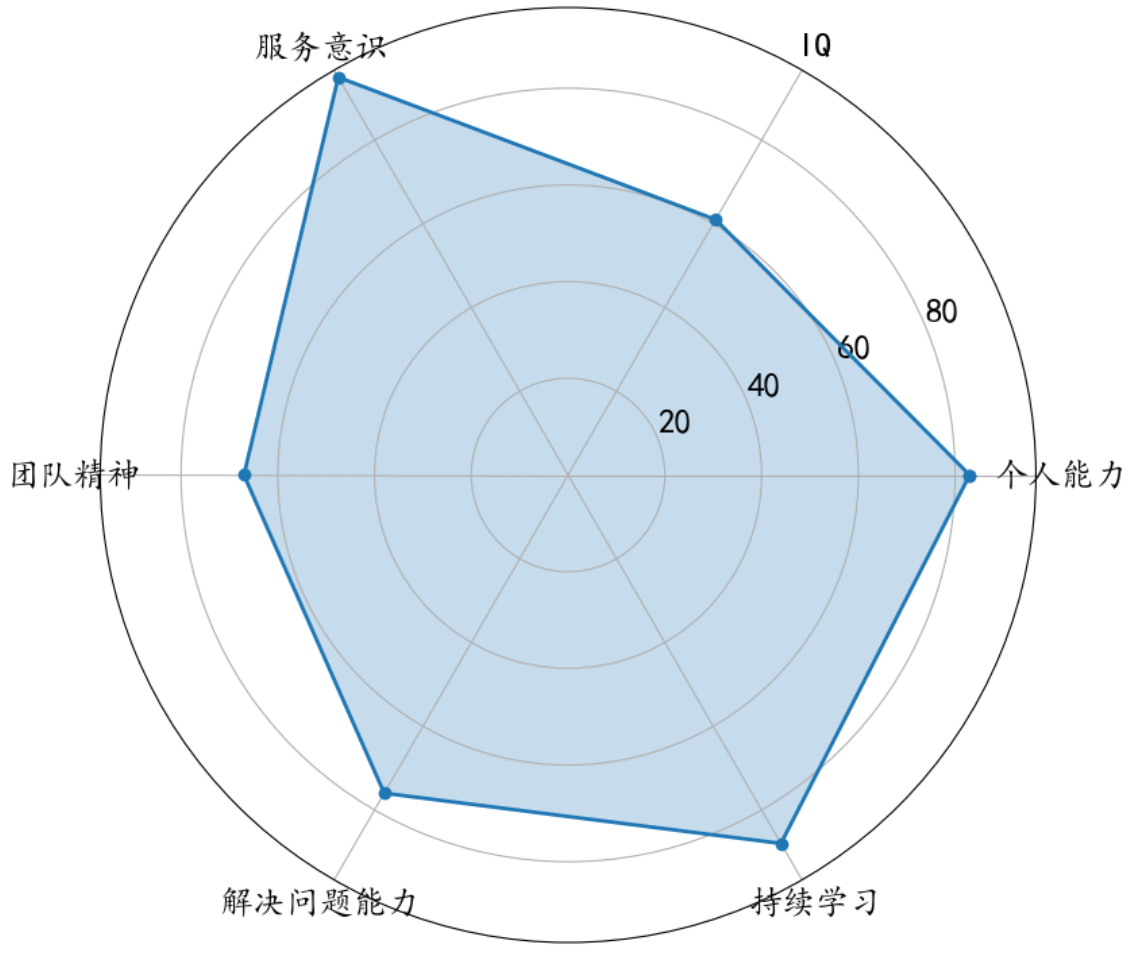
蜘蛛图
import numpy as np
import matplotlib.pyplot as plt
plt.rcParams['font.family'] = 'KaiTi'
labels = np.array(["个人能力", "IQ", "服务意识", "团队精神", "解决问题能力", "持续学习"])
stats = [83, 61, 95, 67, 76, 88]

# 画图数据准备,角度、状态值
angles = np.linspace(0, 2 * np.pi, len(labels), endpoint=False)
stats = np.concatenate((stats, [stats[0]]))
# 保存原始的 angles 数组用于设置标签
original_angles = angles
angles = np.concatenate((angles, [angles[0]]))

# 用 Matplotlib 画蜘蛛图
fig = plt.figure(figsize=(9, 9))
ax = fig.add_subplot(111, polar=True)
ax.plot(angles, stats, 'o-', linewidth=2)  # 连线
ax.fill(angles, stats, alpha=0.25)  # 填充

# 设置角度
ax.set_thetagrids(original_angles * 180 / np.pi,  # 使用原始的 angles 数组
                  labels,
                  fontsize=18)
ax.set_rgrids([20, 40, 60, 80], fontsize=18)
plt.show()
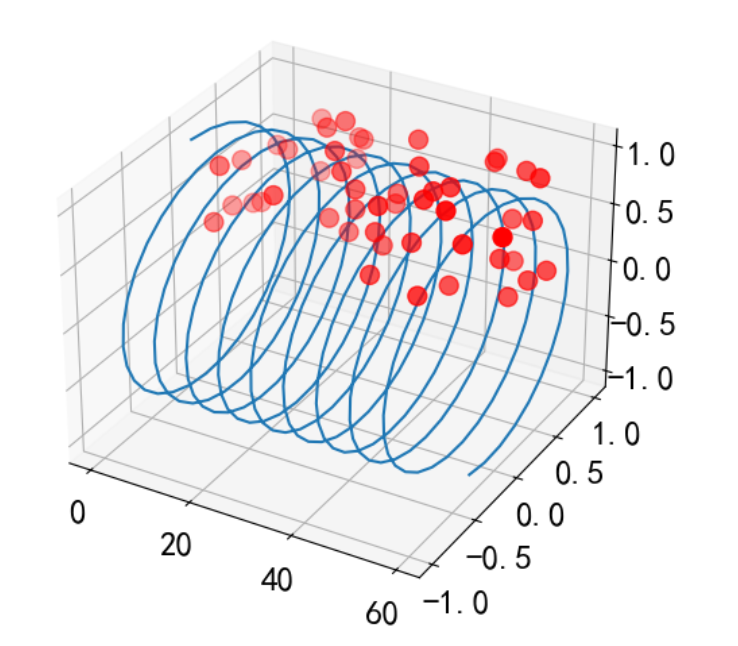
3D图形
三维折线图散点图
import numpy as np
import matplotlib.pyplot as plt
from mpl_toolkits.mplot3d.axes3d import Axes3D  # 3D 引擎
plt.rcParams['axes.unicode_minus'] = False  # 确保负号正常显示
x = np.linspace(0, 60, 300)
y = np.sin(x)
z = np.cos(x)

fig = plt.figure(figsize=(9, 6))  # 二维图形
# 使用 add_subplot 创建 3D 坐标系
ax3 = fig.add_subplot(111, projection='3d')
ax3.plot(x, y, z)  # 3 维折线图
# 3 维散点图
ax3.scatter(np.random.rand(50) * 60, np.random.rand(50), np.random.rand(50),
            color='red', s=100)
plt.show()
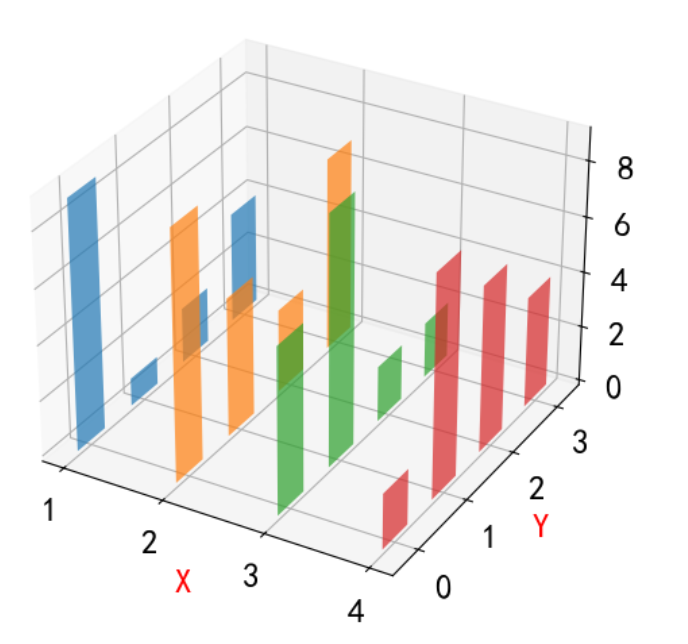
三维柱状图
import numpy as np
import matplotlib.pyplot as plt

month = np.arange(1,5)
# 每个月 4周 每周都会产生数据
# 三个维度:月、周、销量
fig = plt.figure(figsize=(9,6))
ax3 = fig.add_subplot(111, projection='3d')

for m in month:
    ax3.bar(np.arange(4),
            np.random.randint(1,10,size = 4),
            zs = m ,
            zdir = 'x',# 在哪个方向上,一排排排列
            alpha = 0.7,# alpha 透明度
            width = 0.5)
ax3.set_xlabel('X',fontsize = 18,color = 'red')
ax3.set_ylabel('Y',fontsize = 18,color = 'red')
ax3.set_zlabel('Z',fontsize = 18,color = 'green')
Matplotlib库的介绍就到此结束啦!


 被折叠的 条评论
为什么被折叠?
被折叠的 条评论
为什么被折叠?
 到【灌水乐园】发言


