安装ECharts
npm install echarts --save
引入模块
// 引入 ECharts 主模块
import * as echarts from 'echarts';
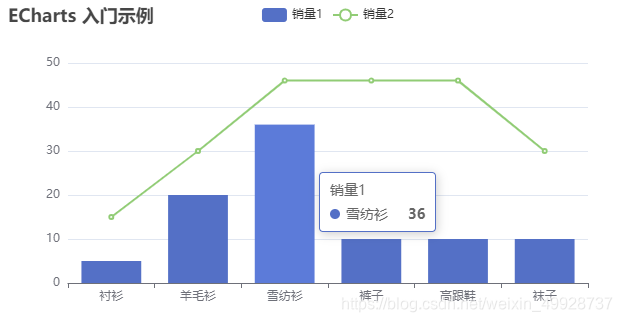
入门示例
import * as echarts from 'echarts';
import ReactDOM from 'react-dom';
import React, { Component } from 'react';

class Index extends Component {
    componentDidMount() {
        // 基于准备好的dom,初始化echarts实例
        var myChart = echarts.init(document.getElementById('forms'));
        // 绘制图表
        myChart.setOption({
            title: {
                text: 'ECharts 入门示例'
            },
            tooltip: {},
            legend: {
                data:['销量1','销量2']
            },
            xAxis: {
                data: ["衬衫","羊毛衫","雪纺衫","裤子","高跟鞋","袜子"]
            },
            yAxis: {},
            series: [
                {
                name: '销量1',
                type: 'bar',
                data: [5, 20, 36, 10, 10, 20]
                },
                {
                    name: '销量2',
                    type: 'line',
                    data: [15, 30, 46, 46, 46, 30]
                }
            ]
        });
    }
    render() {
        return (
            <div id="forms" style={{width:'650px',height:'350px'}}></div>
        )
    }
}

ReactDOM.render(
  <Index />,
  document.getElementById('root')
)
运行结果
向后台发送请求获取数据
import * as echarts from 'echarts';
import ReactDOM from 'react-dom';
import React, { Component } from 'react';

class Index extends Component {
  constructor(props) {
    super(props);
    this.state = {
      data1: [],
      data2: []
    }
  }

  componentDidMount() {
    /*
    * 页面加载时从后台获取数据
    */
    this.getData();
  }

  getData() { //请求数据函数
    fetch('请求路径', {
      method: 'GET'
    }).then(res => res.json()).then(
      data => {
        this.setState({
          data1: data.data1,
          data2: data.data2
        })

        this.demo()
      }
    )
  }

  demo() {
    // 基于准备好的dom,初始化echarts实例
    var myChart = echarts.init(document.getElementById('forms'));
    // 绘制图表
    myChart.setOption({
      title: {
        text: 'ECharts 入门示例'
      },
      tooltip: {},
      legend: {
        data: ['销量1', '销量2']
      },
      xAxis: {
        data: ["衬衫", "羊毛衫", "雪纺衫", "裤子", "高跟鞋", "袜子"]
      },
      yAxis: {},
      series: [
        {
          name: '销量1',
          type: 'bar',
          data: this.state.data1
        },
        {
          name: '销量2',
          type: 'line',
          data: this.state.data2
        }
      ]
    });
  }

  render() {
    return (
      <div id="forms" style={{ width: '650px', height: '350px' }}></div>
    )
  }
}

ReactDOM.render(
  <Index />,
  document.getElementById('root')
)
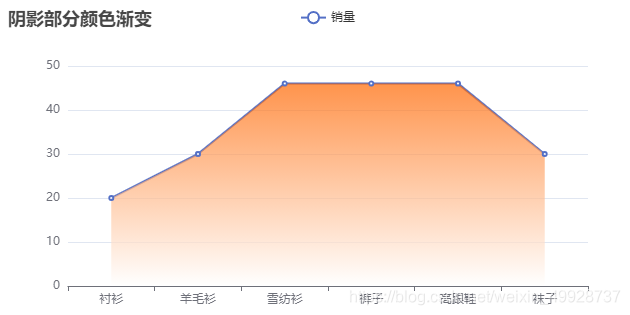
设置阴影部分颜色渐变
import * as echarts from 'echarts';
import ReactDOM from 'react-dom';
import React, { Component } from 'react';

class Index extends Component {
    componentDidMount() {
        // 基于准备好的dom,初始化echarts实例
        var myChart = echarts.init(document.getElementById('forms'));
        // 绘制图表
        myChart.setOption({
            title: {
                text: '阴影部分颜色渐变'
            },
            tooltip: {},
            legend: {
                data:['销量']
            },
            xAxis: {
                data: ["衬衫","羊毛衫","雪纺衫","裤子","高跟鞋","袜子"]
            },
            yAxis: {},
            series: [
                {
                    name: '销量',
                    type: 'line',
                    data: [20, 30, 46, 46, 46, 30],
                    areaStyle: {
                      color: {
                        // type: 'linear',
                        x: 0,
                        y: 0,
                        x2: 0,
                        y2: 1,
                        colorStops: [{
                            offset: 0, color: '#FF6600' // 0% 处的颜色
                        }, {
                           // offset: 0.5, color: '#FFFFFF' // 100% 处的颜色
                            offset: 1, color: '#FFFFFF' // 100% 处的颜色
                        }],
                        global: false // 缺省为 false
                      }
                    }
                }
            ]
        });
    }
    render() {
        return (
            <div id="forms" style={{width:'650px',height:'350px'}}></div>
        )
    }
}

ReactDOM.render(
  <Index />,
  document.getElementById('root')
)
运行结果
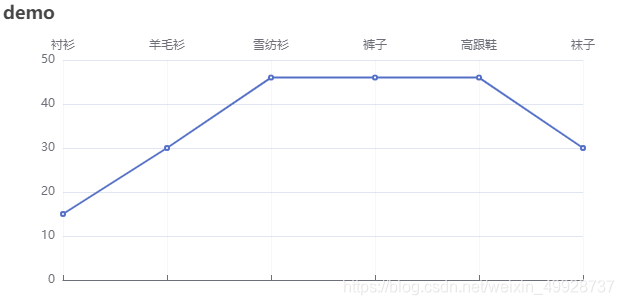
x轴的一些配置
import * as echarts from 'echarts';
import ReactDOM from 'react-dom';
import React, { Component } from 'react';

class Index extends Component {
  componentDidMount() {
    // 基于准备好的dom,初始化echarts实例
    var myChart = echarts.init(document.getElementById('forms'));
    // 绘制图表
    myChart.setOption({
      title: {
        text: 'demo'
      },
      tooltip: {},
      legend: {
        data: ['销量']
      },
      xAxis: {
        boundaryGap: false,//默认true,数据显示在刻度线中间,false显示在刻度线上
        position: "top",//数据显示位置,默认在下面,top显示在上面
        data: ["衬衫", "羊毛衫", "雪纺衫", "裤子", "高跟鞋", "袜子"],
        splitLine: {
          show: true, //是否显示分割线
          lineStyle: { //刻度线的样式设置。
            color:'#FF9933',
            opacity: 0.1
          }
        },
        //axisLine: {show:false},//默认true,显示轴线,false不显示轴线
      },
      yAxis: {
      },
      series: [
        {
          name: '销量1',
          type: 'line',
          data: [15, 30, 46, 46, 46, 30],
        }
      ]
    });
  }
  render() {
    return (
      <div id="forms" style={{ width: '650px', height: '350px' }}></div>
    )
  }
}

ReactDOM.render(
  <Index />,
  document.getElementById('root')
)
运行结果
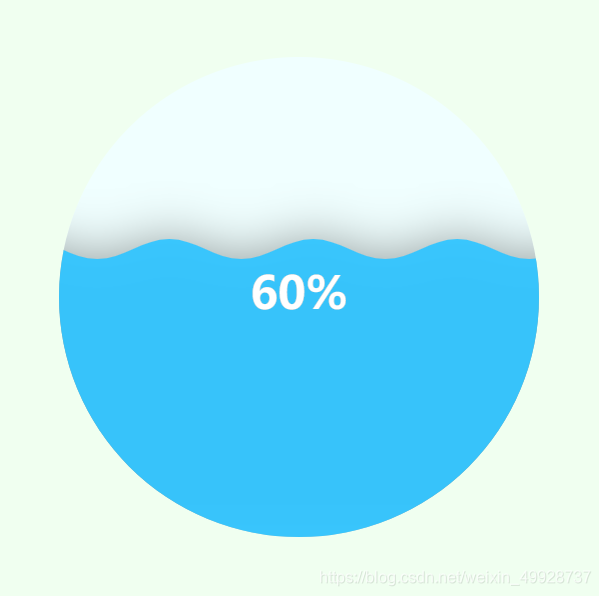
使用echarts水波球
在package.json中引入echarts-liquidfill
"echarts-liquidfill": "^2.0.2",
创建waterWavBallEcharts.js
import * as echarts from "echarts";
import "echarts-liquidfill";

export function shuiBoQiuchers(id,data) {
    var chartDom = document.getElementById(id);
    if (null != chartDom) {
        var myChart = echarts.init(chartDom);
        var option = {
            backgroundColor: '#F0FFF0',
            series: [
                {
                    type: 'liquidFill',
                    radius: '80%',
                    center: ['50%', '50%'],
                    data: data,
                    backgroundStyle: {
                        borderWidth: 1,
                        color: '#F0FFFF'
                    },
                    waveLength: '30%',
                    amplitude: 10,//波浪的幅度
                    itemStyle: {
                        color: '#32C5FF'
                    },
                    label: {
                        normal: {
                            formatter: function (value) {
                                return  value.data*100 + '%';
                            },
                            textStyle: {
                                fontSize: 45,
                                color: '#000'
                            }
                        }
                    },
                    outline: {
                        show: false,
                    }
                },
            ]
        }
        option && myChart.setOption(option);
    }
}
引入waterWavBallEcharts
import React from 'react';
import ReactDOM from 'react-dom';
import {shuiBoQiuchers} from "./waterWavBallEcharts";

export class WaterWavBall extends React.Component{

  componentDidMount(){
    let data=[0.6];
    shuiBoQiuchers("shuiboqiu", data);
  }

  render(){
    return (
        <div id="shuiboqiu" style={{width:600,height:600}}></div>
    )
  }
}

ReactDOM.render(
  <React.StrictMode>
    <WaterWavBall />
  </React.StrictMode>,
  document.getElementById('root')
);
完成效果如下


 674
674

 被折叠的 条评论
为什么被折叠?
被折叠的 条评论
为什么被折叠?
 到【灌水乐园】发言


