


一、简单使用
pic_chart=findViewById(R.id.pic_chart);
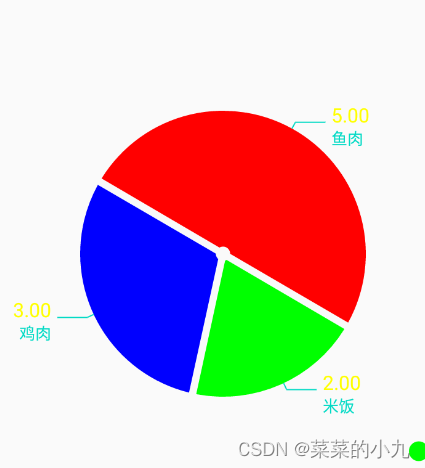
list.add(new PieEntry(2f,"米饭"));
list.add(new PieEntry(3f,"鸡肉"));
list.add(new PieEntry(5f,"鱼肉"));
pieDataSet=new PieDataSet(list,"吃的饭菜");
//为每个分组设置颜色,如果不为每个都设置颜色最后饼图只会有一个颜色,这样无法有效看出占比
pieDataSet.setColors(Color.GREEN,Color.BLUE,Color.RED);
pieData=new PieData(pieDataSet);
pic_chart.setData(pieData);效果展示
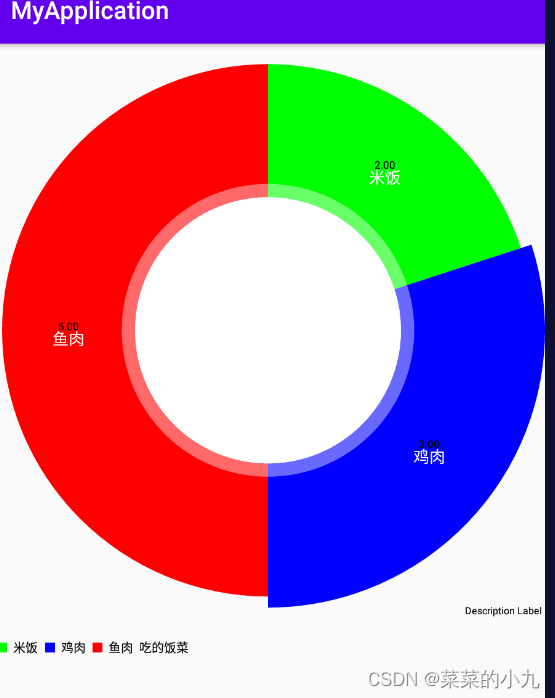
注:一定要为每个都设置颜色不然就只会出现一个颜色,没有设置颜色产生的效果

二、对标题的设置
private void title() {
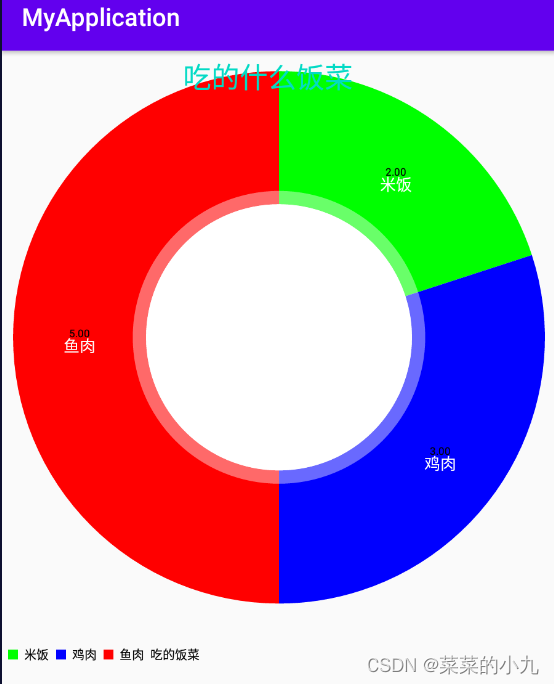
Description description=new Description();
//设置标题
description.setText("吃的什么饭菜");
//设置标题颜色
description.setTextColor(getResources().getColor(R.color.colorAccent));
//设置标题字体大小
description.setTextSize(23f);
//设置标题位置
WindowManager windowManager= (WindowManager) this.getSystemService(WINDOW_SERVICE);
DisplayMetrics displayMetrics=new DisplayMetrics();
windowManager.getDefaultDisplay().getMetrics(displayMetrics);
description.setPosition(displayMetrics.widthPixels/2+120,60);
pic_chart.setDescription(description);
}效果展示
三、设置饼图的位置
//设置饼图位置(偏移量)
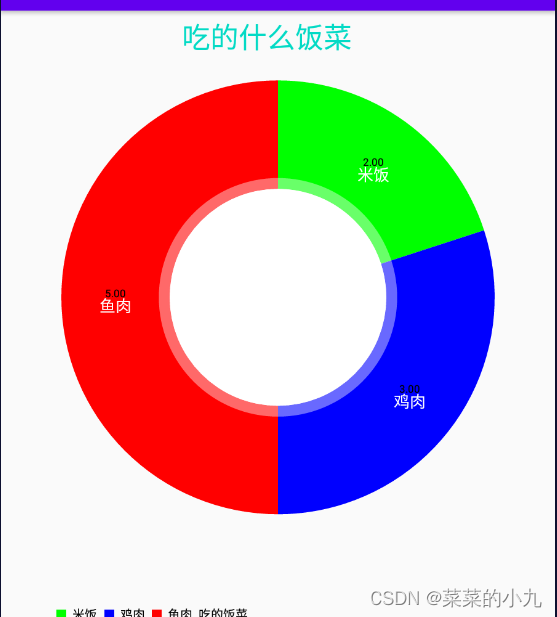
pic_chart.setExtraOffsets(20,20,20,20);效果展示
四、对图例的设置
 private void legend() {
        //获取图例的实例
        Legend legend=pic_chart.getLegend();
        //图例文字的大小
        legend.setTextSize(16f);
        //图例文字的颜色
        legend.setTextColor(getResources().getColor(R.color.colorAccent));
        //图例的大小
        legend.setFormSize(16f);
        //图例的模式
        legend.setForm(Legend.LegendForm.CIRCLE);
        //图例的位置
        //图例水平方向为靠右
        legend.setHorizontalAlignment(Legend.LegendHorizontalAlignment.RIGHT);
        //图例垂直方向居中
        legend.setVerticalAlignment(Legend.LegendVerticalAlignment.CENTER);
        //图例分布模式(这里是垂直分布,默认的为水平分布)
        legend.setOrientation(Legend.LegendOrientation.VERTICAL);
    }
效果展示

五、对图形的设置
private void init() {
//设置图形上文字的大小
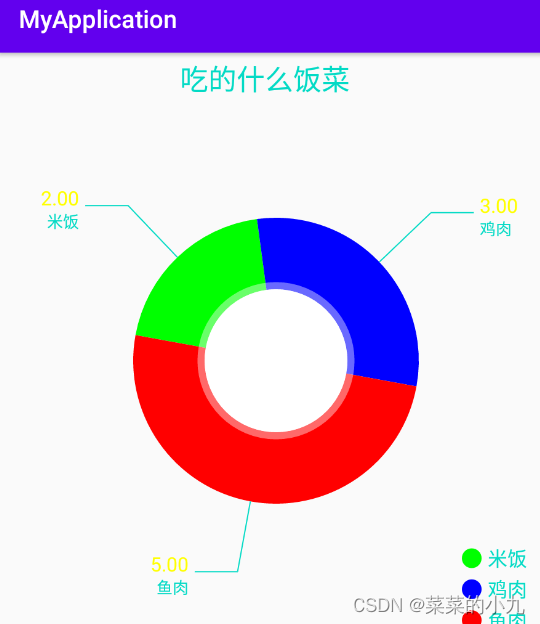
pieDataSet.setValueTextSize(16f);
//设置图形上数值的颜色
pieDataSet.setValueTextColor(Color.YELLOW);
//是否绘制饼图上的文字
// pieDataSet.setDrawValues(true);
//文字绘制在图形内还是图形外(这里绘制在外部。默认在内部)
pieDataSet.setXValuePosition(PieDataSet.ValuePosition.OUTSIDE_SLICE);
//图形上的数值绘制在图形内还是图形外(这里绘制在外部。默认在内部)
pieDataSet.setYValuePosition(PieDataSet.ValuePosition.OUTSIDE_SLICE);
//连线的颜色
pieDataSet.setValueLineColor(getResources().getColor(R.color.colorAccent));
// 设置图形上文字的颜色
pic_chart.setEntryLabelColor(getResources().getColor(R.color.colorAccent));
//设置连线长度
pieDataSet.setValueLinePart1Length(1f);
//设置连线长度是否可变
pieDataSet.setValueLineVariableLength(false);
//设置连接线距离饼图的距离
pieDataSet.setValueLinePart1OffsetPercentage(100f);
}效果展示
//设置图形是否绘制空洞
        pic_chart.setDrawHoleEnabled(true);
        //设置空心圆半径的大小
        pic_chart.setHoleRadius(5f);
        //设置空心圆颜色
        pic_chart.setHoleColor(Color.TRANSPARENT);
        //设置透明圈的透明度
        pic_chart.setTransparentCircleAlpha(0);
        //设置饼块与饼块之间的距离
        pieDataSet.setSliceSpace(6f);
效果展示
结语:有很多属性没有实现,如果我有任何错误或不准确的地方,请各位大佬批评指正,我将非常感激您的帮助。


 7565
7565


 被折叠的 条评论
为什么被折叠?
被折叠的 条评论
为什么被折叠?
 到【灌水乐园】发言


