


QCustomPlot *customPlot=ui->customPlot;
customPlot->addGraph();
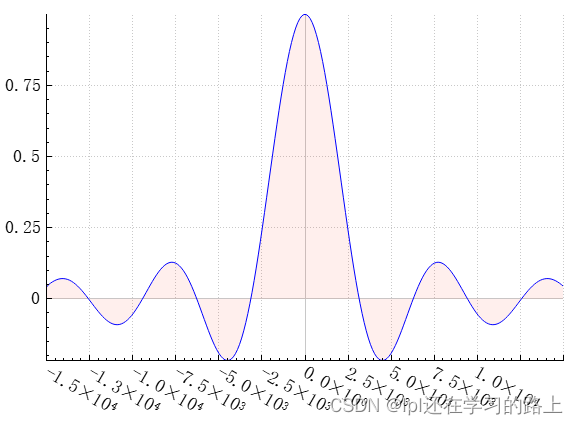
customPlot->graph(0)->setBrush(QBrush(QColor(255,50,30,20)));
QVector<double> x0(250), y0(250);
for (int i=0; i<250; ++i)
{
x0[i] = (i/249.0-0.5)*30;
y0[i] = qSin(x0[i])/x0[i];
x0[i] *= 1000;
}
customPlot->graph(0)->setData(x0, y0);
customPlot->graph(0)->rescaleAxes();
customPlot->xAxis->setTickLabelRotation(30);
customPlot->xAxis->ticker()->setTickCount(9);
customPlot->xAxis->setNumberFormat("ebc");
customPlot->xAxis->setNumberPrecision(1);
关键代码:
customPlot->graph(0)->rescaleAxes();
void QCPAbstractPlottable::rescaleAxes ( bool  onlyEnlarge = false) const
Rescales the key and value axes associated with this plottable to contain all displayed data, so the whole plottable is visible. If the scaling of an axis is logarithmic, rescaleAxes will make sure not to rescale to an illegal range i.e. a range containing different signs and/or zero. Instead it will stay in the current sign domain and ignore all parts of the plottable that lie outside of that domain.

onlyEnlarge makes sure the ranges are only expanded, never reduced. So it's possible to show multiple plottables in their entirety by multiple calls to rescaleAxes where the first call has onlyEnlarge set to false (the default), and all subsequent set to true.
重新缩放与该图表关联的键轴和值轴,以包含所有显示的数据,这样整个图表就可见了。
如果轴的缩放是对数的,则rescaleAxes将确保不会重新缩放到非法范围,即包含不同符号和/或零的范围。相反,它将停留在当前符号域,并忽略位于该域之外的可绘图表的所有部分。
onlyEnlarge确保范围只扩大,而不是缩小。因此,可以通过多次调用rescaleAxes来完整地显示多个绘图表,其中第一次调用仅将enlarge设置为false(默认值),所有后续调用均设置为true。
       QCustomPlot *customPlot=ui->customPlot;

       customPlot->addGraph();
       customPlot->graph(0)->setBrush(QBrush(QColor(255,50,30,20)));

       customPlot->addGraph();
       customPlot->graph(1)->setBrush(QBrush(QColor(100,50,30)));

       QVector<double> x0(250), y0(250);
       QVector<double> yConfUpper(250), yConfLower(250);
       for (int i=0; i<250; ++i)
       {
         x0[i] = (i/249.0-0.5)*30;
         y0[i] = qSin(x0[i])/x0[i];
         yConfUpper[i] = y0[i]+0.15;
         yConfLower[i] = y0[i]-0.15;
         x0[i] *= 1000;
       }
       customPlot->graph(0)->setData(x0, yConfUpper);
       customPlot->graph(0)->rescaleAxes();

       customPlot->xAxis->setTickLabelRotation(30);
       customPlot->xAxis->ticker()->setTickCount(9);
       customPlot->xAxis->setNumberFormat("ebc");
       customPlot->xAxis->setNumberPrecision(1);
左图对应上面的代码,右图对应下面的代码
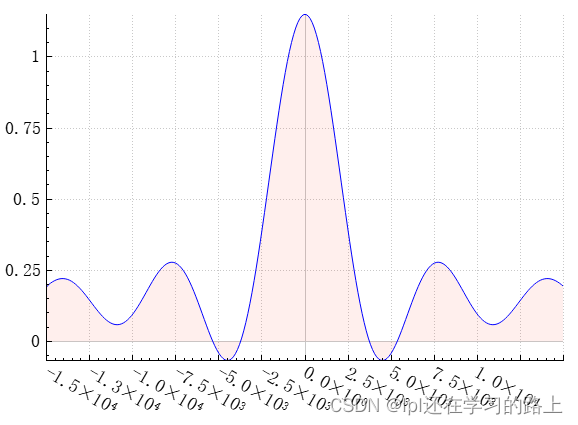
       QCustomPlot *customPlot=ui->customPlot;

       customPlot->addGraph();
       customPlot->graph(0)->setBrush(QBrush(QColor(255,50,30,20)));

       customPlot->addGraph();
       customPlot->graph(1)->setBrush(QBrush(QColor(100,50,30)));

       QVector<double> x0(250), y0(250);
       QVector<double> yConfUpper(250), yConfLower(250);
       for (int i=0; i<250; ++i)
       {
         x0[i] = (i/249.0-0.5)*30;
         y0[i] = qSin(x0[i])/x0[i];
         yConfUpper[i] = y0[i]+0.15;
         yConfLower[i] = y0[i]-0.15;
         x0[i] *= 1000;
       }
       customPlot->graph(1)->setData(x0, yConfLower);
       customPlot->graph(1)->rescaleAxes();

       customPlot->xAxis->setTickLabelRotation(30);
       customPlot->xAxis->ticker()->setTickCount(9);
       customPlot->xAxis->setNumberFormat("ebc");
       customPlot->xAxis->setNumberPrecision(1);
       //customPlot->xAxis->moveRange(-10);
QCustomPlot *customPlot=ui->customPlot;
customPlot->addGraph();
customPlot->graph(0)->setBrush(QBrush(QColor(255,50,30,20)));
customPlot->addGraph();
customPlot->graph(1)->setBrush(QBrush(QColor(100,50,30)));
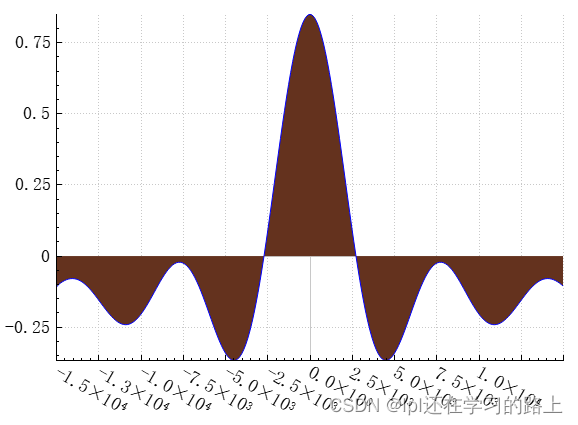
customPlot->graph(0)->setChannelFillGraph(customPlot->graph(1));
QVector<double> x0(250), y0(250);
QVector<double> yConfUpper(250), yConfLower(250);
for (int i=0; i<250; ++i)
{
x0[i] = (i/249.0-0.5)*30;
y0[i] = qSin(x0[i])/x0[i];
yConfUpper[i] = y0[i]+0.15;
yConfLower[i] = y0[i]-0.15;
x0[i] *= 1000;
}
customPlot->graph(0)->setData(x0, yConfUpper);
customPlot->graph(1)->setData(x0, yConfLower);
customPlot->graph(0)->rescaleAxes();
customPlot->graph(1)->rescaleAxes();
customPlot->xAxis->setTickLabelRotation(30);
customPlot->xAxis->ticker()->setTickCount(9);
customPlot->xAxis->setNumberFormat("ebc");
customPlot->xAxis->setNumberPrecision(1); 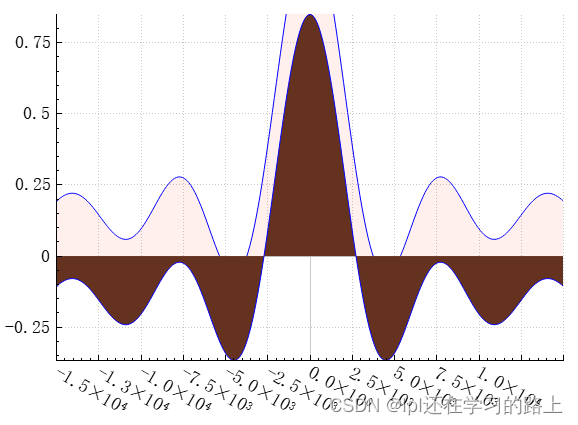
修改一处代码:
customPlot->graph(1)->rescaleAxes(true);
void QCPGraph::setChannelFillGraph ( QCPGraph *  targetGraph)
Sets the target graph for filling the area between this graph and targetGraph with the current brush (setBrush).

When targetGraph is set to 0, a normal graph fill to the zero-value-line will be shown. To disable any filling, set the brush to Qt::NoBrush.
设置目标图形,用当前画笔(setBrush)填充该图形和targetGraph之间的区域。
当targetGraph设置为0时,将显示一个法线图形填充到零值线。要禁用任何填充,请将画笔设置为Qt::NoBrush。
customPlot->graph(0)->setChannelFillGraph(customPlot->graph(1));图形0与图形1重合的部分,使用当前画笔QBrush(QColor(100,50,30))填充重合部分。


 1万+
1万+

 被折叠的 条评论
为什么被折叠?
被折叠的 条评论
为什么被折叠?
 到【灌水乐园】发言


