


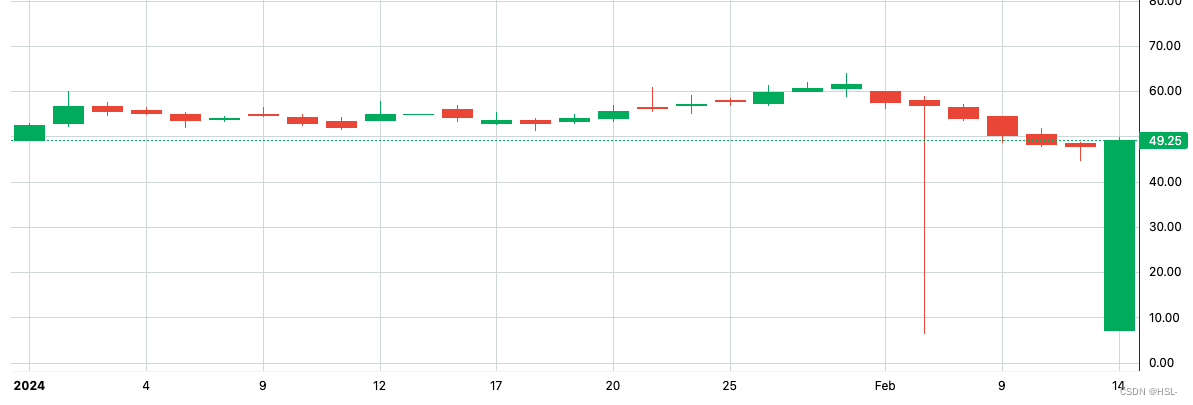
1.以k线图为例, 首先简单的绘制一下
x-charts.ts
import { createChart } from 'lightweight-charts';
const stickOption = {
  localization: {
    locale: 'en-US'
  },
  layout: {
    textColor: 'black',
    background: { type: 'solid', color: 'white' }
  },
  timeScale: {
    borderColor: '#F5F5F5',
    timeZone: 'Etc/UTC'
  },
  height: 400
};

// 创建k线图
let stickChart: any = null;
const stickChartInit = (domId: string) => {
  stickChart = createChart(
    document.getElementById(domId) as HTMLElement,
    stickOption as any
  );
};

// 渲染k线图
let stickSeries: any = null;
const stickSyncToInterval = (data: any) => {
  if (stickSeries) {
    stickChart.removeSeries(stickSeries);
    stickSeries = null;
  }
  stickSeries = stickChart.addCandlestickSeries({
    upColor: '#18B762',
    downColor: '#E8503A',
    borderVisible: false,
    wickUpColor: '#18B762',
    wickDownColor: '#E8503A'
  });
  stickSeries.setData(data);
  stickChart.timeScale().fitContent();
};

// 清除
const closeCharts = () => {
  stickSeries = null;
};

export default {
  stickChartInit,
  stickSyncToInterval,
  closeCharts
};
在vue代码中
<template>
  <div id="Kcharts" style="width: 100vw;"></div>
</template>

<script setup lang="ts">
// 导入封装的文件
import xCharts from './x.charts';

// 假数据, 数据open, close, high, low, 类型必须为number否则图表报错
 const list = [
      {
        open: 49.2,
        close: 52.5,
        high: 52.9,
        low: 49.2,
        time: '2024-01-01'
      },
      {
        open: 52.85,
        close: 56.65,
        high: 60.1,
        low: 52.2,
        time: '2024-01-02'
      },
      {
        open: 56.8,
        close: 55.55,
        high: 57.5,
        low: 54.75,
        time: '2024-01-03'
      },
      {
        open: 55.9,
        close: 55.15,
        high: 56.4,
        low: 54.9,
        time: '2024-01-04'
      },
      {
        open: 54.9,
        close: 53.65,
        high: 55.45,
        low: 52,
        time: '2024-01-05'
      },
      {
        open: 53.85,
        close: 54.1,
        high: 54.6,
        low: 53.45,
        time: '2024-01-08'
      },
      {
        open: 54.9,
        close: 54.8,
        high: 56.45,
        low: 54.5,
        time: '2024-01-09'
      },
      {
        open: 54.3,
        close: 53,
        high: 54.9,
        low: 52.45,
        time: '2024-01-10'
      },
      {
        open: 53.35,
        close: 52.05,
        high: 54.3,
        low: 51.65,
        time: '2024-01-11'
      },
      {
        open: 53.5,
        close: 55,
        high: 57.9,
        low: 53.5,
        time: '2024-01-12'
      },
      {
        open: 55,
        close: 55,
        high: 55,
        low: 55,
        time: '2024-01-15'
      },
      {
        open: 56,
        close: 54.2,
        high: 56.85,
        low: 53.45,
        time: '2024-01-16'
      },
      {
        open: 53.05,
        close: 53.6,
        high: 55.45,
        low: 52.7,
        time: '2024-01-17'
      },
      {
        open: 53.5,
        close: 52.95,
        high: 53.95,
        low: 51.5,
        time: '2024-01-18'
      },
      {
        open: 53.4,
        close: 54,
        high: 54.85,
        low: 53,
        time: '2024-01-19'
      },
      {
        open: 54,
        close: 55.6,
        high: 56.85,
        low: 53.4,
        time: '2024-01-20'
      },
      {
        open: 56.55,
        close: 56.15,
        high: 60.8,
        low: 55.55,
        time: '2024-01-23'
      },
      {
        open: 56.9,
        close: 57.2,
        high: 59.1,
        low: 55.05,
        time: '2024-01-24'
      },
      {
        open: 58,
        close: 57.75,
        high: 58.45,
        low: 56.95,
        time: '2024-01-25'
      },
      {
        open: 57.45,
        close: 59.85,
        high: 61.4,
        low: 56.85,
        time: '2024-01-29'
      },
      {
        open: 60,
        close: 60.6,
        high: 62,
        low: 60,
        time: '2024-01-30'
      },
      {
        open: 60.6,
        close: 61.55,
        high: 63.9,
        low: 59,
        time: '2024-01-31'
      },
      {
        open: 60,
        close: 57.5,
        high: 60,
        low: 56.3,
        time: '2024-02-01'
      },
      {
        open: 58.1,
        close: 56.9,
        high: 58.8,
        low: 6.6,
        time: '2024-02-02'
      },
      {
        open: 56.5,
        close: 54,
        high: 57.2,
        low: 53.6,
        time: '2024-02-08'
      },
      {
        open: 54.4,
        close: 50.25,
        high: 54.5,
        low: 48.85,
        time: '2024-02-09'
      },
      {
        open: 50.5,
        close: 48.25,
        high: 51.8,
        low: 47.85,
        time: '2024-02-12'
      },
      {
        open: 48.45,
        close: 47.95,
        high: 48.7,
        low: 44.85,
        time: '2024-02-13'
      },
      {
        open: 7.15,
        close: 49.25,
        high: 49.8,
        low: 46.9,
        time: '2024-02-14'
      }
    ];

onMounted(() => {
      xCharts.stickChartInit('Kcharts');
      xCharts.stickSyncToInterval(list);
    });
</script>
画出k线图
2.如果需要多图绘制在同一张charts中,以柱状图为例, 需要对x-charts文件中的一些方法做修改
x-charts.ts
import { createChart } from 'lightweight-charts';
const stickOption = {
  localization: {
    locale: 'en-US'
  },
  layout: {
    textColor: 'black',
    background: { type: 'solid', color: 'white' }
  },
  timeScale: {
    borderColor: '#F5F5F5',
    timeZone: 'Etc/UTC'
  },
  rightPriceScale: {
    // 设置的k线图的上下距离,防止和柱状图重叠
    scaleMargins: {
      top: 0.4,
      bottom: 0.25
    },
    borderColor: '#F5F5F5'
  },
  height: 400
};

// 创建图表
let stickChart: any = null;
const stickChartInit = (domId: string) => {
  stickChart = createChart(
    document.getElementById(domId) as HTMLElement,
    stickOption as any
  );
};

// 渲染k线图和柱状图
let stickSeries: any = null;
let sHisSeries: any = null;
const stickSyncToInterval = (data: any, hdata: any) => {
  if (stickSeries) {
    stickChart.removeSeries(stickSeries);
    stickSeries = null;
  }
  if (sHisSeries) {
    stickChart.removeSeries(sHisSeries);
    sHisSeries = null;
  }
  stickSeries = stickChart.addCandlestickSeries({
    upColor: '#18B762',
    downColor: '#E8503A',
    borderVisible: false,
    wickUpColor: '#18B762',
    wickDownColor: '#E8503A'
  });
  // 同时渲染柱状图
  sHisSeries = stickChart.addHistogramSeries({
    color: '#F1F5F9',
    priceFormat: {
      type: 'volume'
    },
    priceScaleId: ''
  });
  stickChart.priceScale('').applyOptions({
    // 设置的柱状图上下距离 防止和k线重叠
    scaleMargins: {
      top: 0.8,
      bottom: 0
    }
  });
  stickSeries.setData(data);
  sHisSeries.setData(hdata);
  stickChart.timeScale().fitContent();
};

// 清除
const closeCharts = () => {
  stickSeries = null;
  sHisSeries = null;
};

export default {
  stickChartInit,
  stickSyncToInterval,
  closeCharts
};
在vue代码中
<template>
  <div id="Kcharts" style="width: 100vw;"></div>
</template>

<script setup lang="ts">
// 导入封装的文件
import xCharts from './x.charts';

// 假数据, 数据open, close, high, low, 类型必须为number否则图表报错
 const list = [
      {
        open: 49.2,
        close: 52.5,
        high: 52.9,
        low: 49.2,
        time: '2024-01-01'
      },
      {
        open: 52.85,
        close: 56.65,
        high: 60.1,
        low: 52.2,
        time: '2024-01-02'
      },
      {
        open: 56.8,
        close: 55.55,
        high: 57.5,
        low: 54.75,
        time: '2024-01-03'
      },
      {
        open: 55.9,
        close: 55.15,
        high: 56.4,
        low: 54.9,
        time: '2024-01-04'
      },
      {
        open: 54.9,
        close: 53.65,
        high: 55.45,
        low: 52,
        time: '2024-01-05'
      },
      {
        open: 53.85,
        close: 54.1,
        high: 54.6,
        low: 53.45,
        time: '2024-01-08'
      },
      {
        open: 54.9,
        close: 54.8,
        high: 56.45,
        low: 54.5,
        time: '2024-01-09'
      },
      {
        open: 54.3,
        close: 53,
        high: 54.9,
        low: 52.45,
        time: '2024-01-10'
      },
      {
        open: 53.35,
        close: 52.05,
        high: 54.3,
        low: 51.65,
        time: '2024-01-11'
      },
      {
        open: 53.5,
        close: 55,
        high: 57.9,
        low: 53.5,
        time: '2024-01-12'
      },
      {
        open: 55,
        close: 55,
        high: 55,
        low: 55,
        time: '2024-01-15'
      },
      {
        open: 56,
        close: 54.2,
        high: 56.85,
        low: 53.45,
        time: '2024-01-16'
      },
      {
        open: 53.05,
        close: 53.6,
        high: 55.45,
        low: 52.7,
        time: '2024-01-17'
      },
      {
        open: 53.5,
        close: 52.95,
        high: 53.95,
        low: 51.5,
        time: '2024-01-18'
      },
      {
        open: 53.4,
        close: 54,
        high: 54.85,
        low: 53,
        time: '2024-01-19'
      },
      {
        open: 54,
        close: 55.6,
        high: 56.85,
        low: 53.4,
        time: '2024-01-20'
      },
      {
        open: 56.55,
        close: 56.15,
        high: 60.8,
        low: 55.55,
        time: '2024-01-23'
      },
      {
        open: 56.9,
        close: 57.2,
        high: 59.1,
        low: 55.05,
        time: '2024-01-24'
      },
      {
        open: 58,
        close: 57.75,
        high: 58.45,
        low: 56.95,
        time: '2024-01-25'
      },
      {
        open: 57.45,
        close: 59.85,
        high: 61.4,
        low: 56.85,
        time: '2024-01-29'
      },
      {
        open: 60,
        close: 60.6,
        high: 62,
        low: 60,
        time: '2024-01-30'
      },
      {
        open: 60.6,
        close: 61.55,
        high: 63.9,
        low: 59,
        time: '2024-01-31'
      },
      {
        open: 60,
        close: 57.5,
        high: 60,
        low: 56.3,
        time: '2024-02-01'
      },
      {
        open: 58.1,
        close: 56.9,
        high: 58.8,
        low: 6.6,
        time: '2024-02-02'
      },
      {
        open: 56.5,
        close: 54,
        high: 57.2,
        low: 53.6,
        time: '2024-02-08'
      },
      {
        open: 54.4,
        close: 50.25,
        high: 54.5,
        low: 48.85,
        time: '2024-02-09'
      },
      {
        open: 50.5,
        close: 48.25,
        high: 51.8,
        low: 47.85,
        time: '2024-02-12'
      },
      {
        open: 48.45,
        close: 47.95,
        high: 48.7,
        low: 44.85,
        time: '2024-02-13'
      },
      {
        open: 7.15,
        close: 49.25,
        high: 49.8,
        low: 46.9,
        time: '2024-02-14'
      }
    ];
// 柱状图数据格式 { time, value }
    const hlist = list.map((item) => {
      return {
        value: item.close,
        time: item.time
      };
    });

onMounted(() => {
      xCharts.stickChartInit('Kcharts');
      xCharts.stickSyncToInterval(list, hlist);
    });
</script>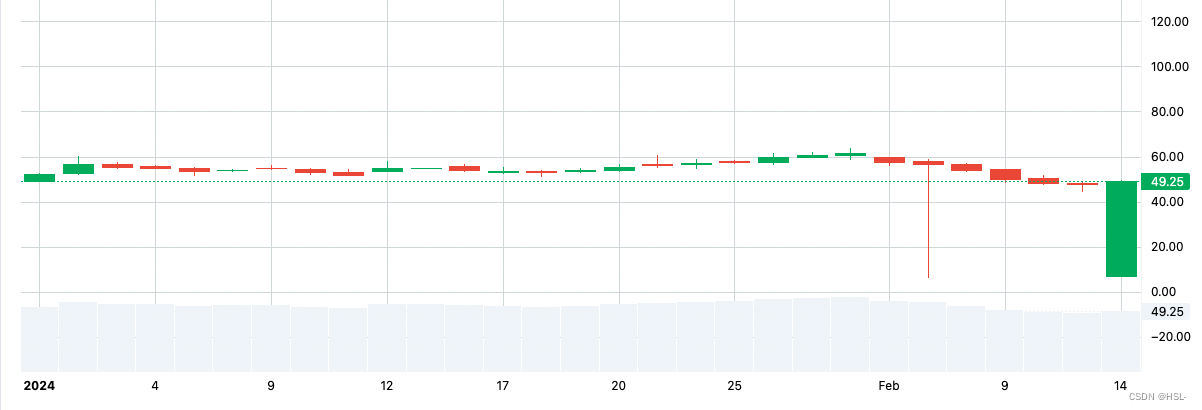
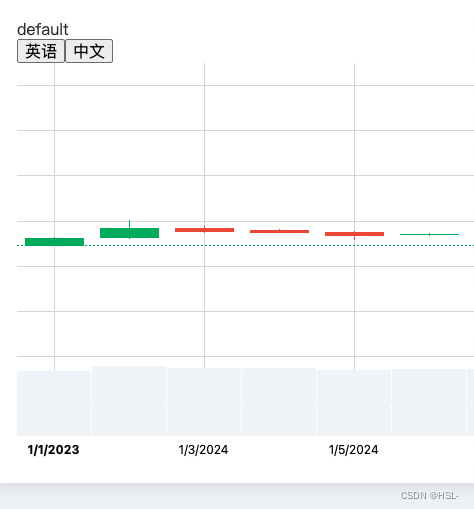
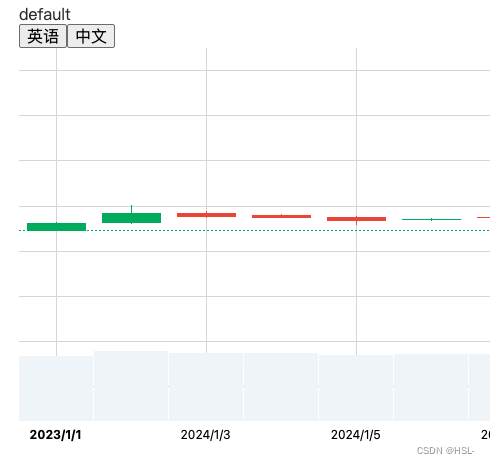
3.怎么动态切换不同国家的时间格式
在 x-charts.ts中加上这段方法
const chartsLangChange = (lang: string) => {
  stickChart.timeScale().applyOptions({
    tickMarkFormatter: (time: any) => {
      const date = new Date(time);
      const formatter = new Intl.DateTimeFormat(lang); // 自定义日期格式
      return formatter.format(date);
    }
  });
};
在vue代码中通过按钮切换
<button @click="onLangChange('en-US')">英语</button>
<button @click="onLangChange('zh-CN')">中文</button>

const onLangChange = (lang: string) => {
      xCharts.chartsLangChange(lang);
    };
4.切换不同的日期区间数据
比如以天为区间/以小时为区间/以周为区间, 只需重新调用stickSyncToInterval方法传入新数据
注意尽量让后端返回的time时间字段转为Etc/UTC的时间戳格式,因为当返回的数据以小时或分钟来渲染的时候时间格式需要Etc/UTC
// 现在给的时间是字符串,当天每小时的数据,这种情况下会导致渲染报错
    const list = [
      {
        open: 49.2,
        close: 52.5,
        high: 52.9,
        low: 49.2,
        time: '2024-01-01 10:00:00'
      },
      {
        open: 52.85,
        close: 56.65,
        high: 60.1,
        low: 52.2,
        time: '2024-01-01 11:00:00'
      },
      {
        open: 56.8,
        close: 55.55,
        high: 57.5,
        low: 54.75,
        time: '2024-01-01 12:00:00'
      },
      {
        open: 55.9,
        close: 55.15,
        high: 56.4,
        low: 54.9,
        time: '2024-01-01 13:00:00'
      }
    ];
会报错只支持yyyy-mm-dd的格式
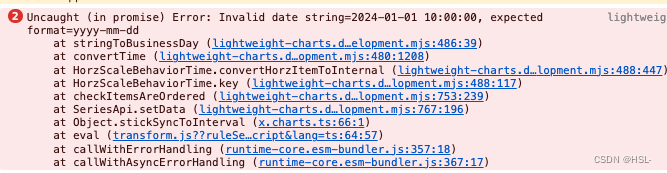
time字段需要UTC时间戳


 1592
1592


 被折叠的 条评论
为什么被折叠?
被折叠的 条评论
为什么被折叠?
 到【灌水乐园】发言


