Numpy
import numpy as np
score=np.array([[80,81,82,83,84],[78,96,95,94,93],[85,83,86,81,89],[78,75,71,73,76],[96,94,93,97,91]])
score.size
type(score)
'''
ndarray属性
shape
ndim
size
dype
itemsize
在创建ndarray的时候,如果没有指定类型
默认
整数:int64
浮点数:float64
'''
'''
基本操作
1.生成数组方法
'''
np.zeros([5,4])
np.ones((5,4))
print(np.zeros([5,4]))
print(np.ones((5,4)))
'''
[[0. 0. 0. 0.]
[0. 0. 0. 0.]
[0. 0. 0. 0.]
[0. 0. 0. 0.]
[0. 0. 0. 0.]]
[[1. 1. 1. 1.]
[1. 1. 1. 1.]
[1. 1. 1. 1.]
[1. 1. 1. 1.]
[1. 1. 1. 1.]]
'''
data1=np.array(score)
data2=np.copy(score)
print(data2)
x=np.linspace(0,10,11)
print(x)
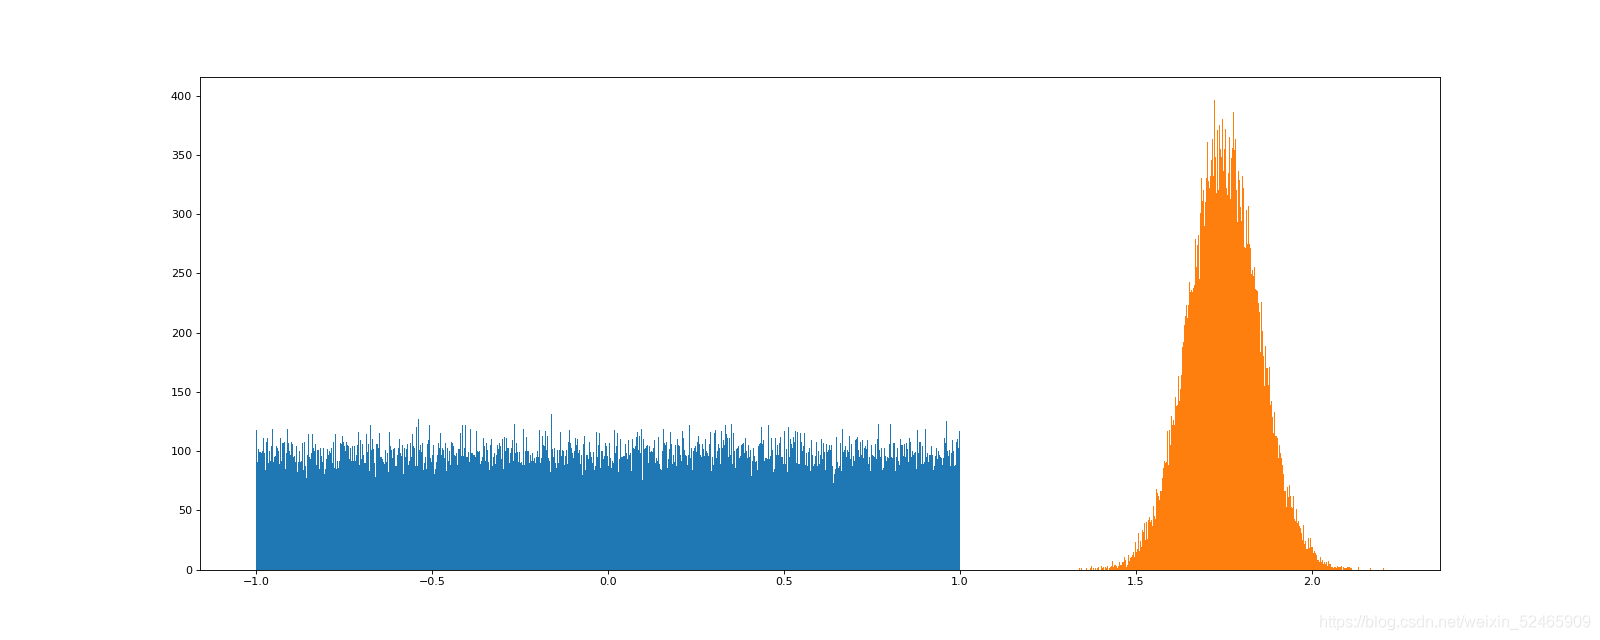
x1=np.random.uniform(-1,1,100000)
print(x1)
import matplotlib.pyplot as plt
plt.figure(figsize=(20,8),dpi=80)
plt.hist(x1,1000)
x2=np.random.normal(1.75,0.1,100000)
plt.hist(x2,1000)
plt.savefig("shujutupian9.png")
plt.show()
import numpy as np
x=np.random.normal(loc=0,scale=1,size=(8,10))
x1=x[0,0:3]
print(x)
print(x1)
print(x.shape)
'''
ndarray.reshape(shape) 返回新的ndarray,原始数据没有改变
ndarray.resize(shape) 没有返回值,对原始的ndarray进行了改变
ndarray.T 转置 行变列,列变行
'''
x2=x.T
print(x2.shape)
print(x2.tostring)
'''
nadarray.astype(type)
ndarray序列化到本地
'''
x3=x>0.5
print(x3)
'''
[[ True True False False False False False True False False]
[False False False False False False False False False True]
[False False False False False False False True False True]
[False False True True False False True False False False]
[ True False True False True False False False True False]
[ True False False False False True False False False False]
[False False False False True False True False False False]
[False False False True False True False False False False]]
'''
print(x[x>0.7])
'''返回所有大于0.7的数
[1.05730176 1.9653545 0.96310443 0.79025379 1.20871883 1.13577481
1.27004206 0.70143188 0.84627271 1.18769169 2.53638775 0.74574605
0.96702949 0.90181432 1.78217411]'''
x[x>0.7]=1.1
print(x[x>0.7])
'''
[1.1 1.1 1.1 1.1 1.1 1.1 1.1 1.1 1.1 1.1 1.1 1.1 1.1 1.1 1.1 1.1 1.1 1.1
1.1 1.1 1.1 1.1 1.1 1.1 1.1]'''
'''
np.all() 同&&
np.any() 同||
'''
np.all(x[0:2,0:5]>0)
print(np.all(x[0:2,0:5]>0))
print(np.any(x[0:2,0:5]>0))
'''
np.where
'''
print(np.where(x[:4,:4]>0,2,-2))
'''大于0则=2,\=-2
[[ 2 -2 -2 -2]
[-2 -2 2 2]
[-2 2 -2 -2]
[-2 -2 -2 2]]'''
print(np.where(np.logical_or(x[:4,:4]>0,x[:4,:4]<-1),2,1))
print(np.where(np.logical_and(x[:4,:4]>0,x[:4,:4]<2),2,1))
'''
[[[2 2 2 1]
[2 1 1 2]
[2 2 2 1]
[1 1 2 2]]
[[2 2 1 2]
[1 2 2 1]
[2 1 2 2]
[2 2 1 1]]]
'''
'''
统计函数指标
max,min,mean,median,var,std
np.argmax最大值所在位置
np.argmin最小值所在位置
'''
print(np.max(x,axis=0))
print(np.max(x,axis=1))
'''
[0.64386042 1.1 1.1 1.1 1.1 1.1
1.1 1.1 0.41923517 1.1 ]
[1.1 1.1 1.1 1.1 1.1 0.55096057
1.1 1.1 ]'''
a=x[:2,:4]
b=x[4:6,:4]
np.hstack(a,b)
print(np.hstack(a,b))
import numpy as np
x=np.array([[1,2,3,4,5,6],[6,5,4,9,8,7]])
print(x+1)
'''
...n维度*...*2维度*1维度(维度从右向左追加)
维度相同且在相同维度上个数相同或为“1”
若有低维度则默认向前追加1
eg 9*7*1*5
7*5*5
'''
'''
矩阵matrix 二维数组
'''
data=np.array([[80,86],[86,79],[79,98],[85,97],[65,94],[90,85]])
data_mat=np.mat([[80,86],[86,79],[79,98],[85,97],[65,94],[90,85]])
print(type(data_mat))
print(type(data))
x2=np.mat([[0.3],[0.7]])
print(data*x2)
print(np.matmul(data,x2))
print(np.dot(data,x2))
x=np.random.normal(loc=0,scale=1,size=(8,10))
print(x)
a=x[:2,:4]
b=x[4:6,:4]
print(np.hstack((a,b)))
print(np.concatenate((a,b),axis=1))
print(np.concatenate((a,b),axis=0))
print(np.vstack((a,b)))
Pandas
'''
核心数据结构
基本操作
运算
画图
文件的存储与读取
'''
import numpy as np
x=np.random.normal(0,1,(10,5))
import pandas as pd
x2=pd.DataFrame(x)
print(x2)
stock=["股票{}".format(i) for i in range (10)]
date=pd.date_range(start="20210814",periods=5,freq="B")
x3=pd.DataFrame(x,index=stock,columns=date)
print(x3)
'''
2021-08-16 2021-08-17 2021-08-18 2021-08-19 2021-08-20
股票0 -0.269843 0.494288 -0.492346 -1.541906 -2.246752
股票1 0.571190 -0.248227 -1.274043 0.465642 -0.311196
股票2 0.405165 0.052852 -0.191542 0.393773 1.592916
股票3 2.066134 0.547554 -0.999797 -0.339771 -0.893654'''
df=pd.DataFrame({'month':[1,4,7,10],'year':[2012,2014,2013,2014],'sale':[55,40,84,31]})
print(df)
x7=df.set_index("month",drop=True)
print(df.set_index("month",drop=True))
print(df.set_index(["year","month"]))
x4=df.set_index(["year","month"])
print(df.set_index(["year","month"]).index)
print(x4.index.names)
print(x4.index.levels)
'''
属性
index
values
方法
'''
x5=pd.Series(np.arange(3,10,2),index=["a","b","c",'d'])
print(x5)
x6=pd.Series({'red':100,'blue':200,'green':300,'yellow':400})
print(x6)
print(df["year"][1])
print(df.loc[1]['year'])
print(df.loc[1,"year"])
print(df.iloc[1,1])
w1=df.sort_values(by="year")
print(w1)
w2=df.sort_values(by="month",ascending=False)
print(w2)
print(df["year"]+3)
print((df-10)>-2)
print((df["year"]>2013)&(df["month"]<7))
print(df[(df["year"]>2013)&(df["month"]<7)])
print(df.query("year>2013&month<7"))
print(df["year"].isin([2012,2013]))
print(df[df["year"].isin([2012,2013])])
print(df.describe())
print(df.max())
print(df.idxmax())
print(df["sale"].sort_index().cumsum().plot())


 2032
2032

 被折叠的 条评论
为什么被折叠?
被折叠的 条评论
为什么被折叠?
 到【灌水乐园】发言


