


echarts实现数据折线图等常见可视化
echarts
是一个基于 JavaScript 的开源可视化库,用于构建交互式和自定义的图表,使数据更加直观和易于理解,由百度开发并于2018年捐赠给 Apache 软件基金会,后来改名为Apache ECharts
类似的还有Chart.js
Chart.js地址:Chart.js 中文网
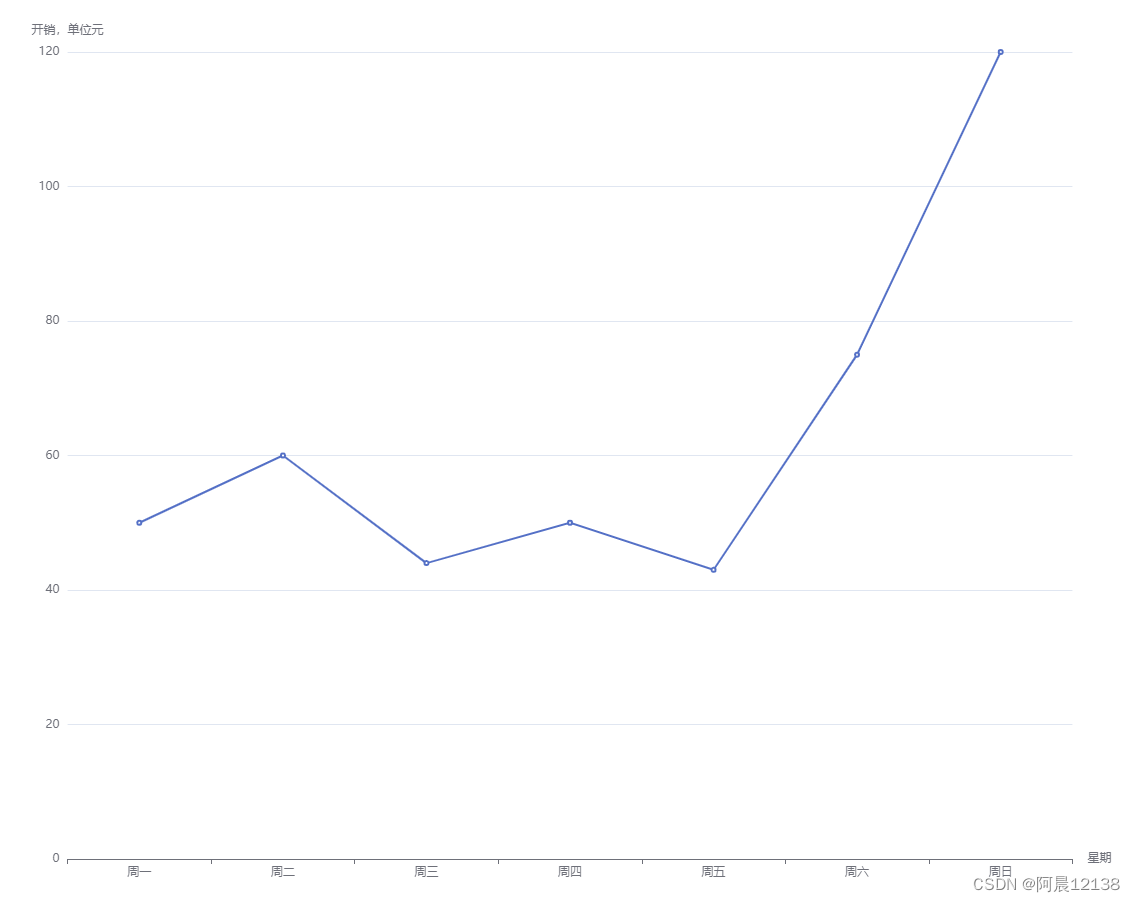
基础折线图
效果图:
源码:
<!DOCTYPE html>
<html lang="zh-CN">

<head>
  <meta charset="utf-8">
  <title>Basic Line Chart - Apache ECharts Demo</title>
  <style>
    * {
      margin: 0;
      padding: 0;
    }

    #chart-container {
      position: relative;
      height: 100vh;
      overflow: hidden;
    }
  </style>
</head>

<body>
  <div id="chart-container"></div>
  <script src="https://fastly.jsdelivr.net/npm/echarts@5.4.3/dist/echarts.min.js"></script>
  <script>
    var dom = document.getElementById('chart-container');
    // init 方法来初始化一个图表实例 myChart
    // 第一个参数 dom 是指定图表容器的 DOM 元素
    // 第二个参数 null 是可选的,表示指定的主题名称。这里传入 null 表示不使用任何主题,将使用默认主题
    // 第三个参数是一个配置对象,用于提供额外的配置选项
    var myChart = echarts.init(dom, null, {
      renderer: 'canvas',
      useDirtyRect: false
    });
    var app = {};

    var option;

    option = {
      // x 轴 类型与数据
      xAxis: {
        type: 'category',
        data: ['周一', '周二', '周三', '周四', '周五', '周六', '周日'],
        name: '星期'
      },
      // y 轴 类型与数据
      yAxis: {
        type: 'value',
        name: '开销,单位元'
      },
      series: [
        {
          // 存放着对应 x 轴类目的数值数据,依次是周一到周日的数值
          data: [50, 60, 44, 50, 43, 75, 120],
          // 表示该系列使用折线图进行展示
          type: 'line',
          // smooth: true 表示启用平滑曲线
          // smooth:true
        }
      ]
    };

    if (option && typeof option === 'object') {
      // 将配置应用到图表实例
      myChart.setOption(option);
    }
    // 监听窗口的 resize 事件,实现了图表在窗口大小变化时的自适应调整
    window.addEventListener('resize', myChart.resize);
  </script>
</body>

</html>
折线图堆叠
效果图:

源码:
<!DOCTYPE html>
<html lang="zh-CN">
<head>
<meta charset="utf-8">
<title>Basic Line Chart - Apache ECharts Demo</title>
<style>
* {
margin: 0;
padding: 0;
}
#chart-container {
position: relative;
height: 100vh;
overflow: hidden;
}
</style>
</head>
<body>
<div id="chart-container"></div>
<script src="https://fastly.jsdelivr.net/npm/echarts@5.4.3/dist/echarts.min.js"></script>
<script>
var dom = document.getElementById('chart-container');
// init 方法来初始化一个图表实例 myChart
// 第一个参数 dom 是指定图表容器的 DOM 元素
// 第二个参数 null 是可选的,表示指定的主题名称。这里传入 null 表示不使用任何主题,将使用默认主题
// 第三个参数是一个配置对象,用于提供额外的配置选项
var myChart = echarts.init(dom, null, {
renderer: 'canvas',
useDirtyRect: false
});
var app = {};
var option;
option = {
// 设置标题
title: {
text: '小周的遐想工资'
},
// 表示鼠标悬停在数据点上时显示提示框
tooltip: {
trigger: 'axis'
},
grid: {
// 设置了图表的内边距
left: '5%',
right: '5%',
bottom: '5%',
// 坐标轴标签显示在内部,以免被裁剪
containLabel: true
},
// toolbox 属性定义了图表的工具箱
toolbox: {
feature: {
// saveAsImage,它表示将图表保存为图片的功能
saveAsImage: {}
}
},
xAxis: {
type: 'category',
// 表示数据从两个刻度之间开始绘制,而不是从刻度上开始
boundaryGap: false,
data: ['周一', '周二', '周三', '周四', '周五', '周六', '周日'],
name: '星期'
},
yAxis: {
type: 'value',
name: '日薪'
},
series: [
{
name: '一年',
type: 'line',
data: [300, 300, 300, 300, 300, 600, 600]
},
{
name: '两年',
type: 'line',
data: [380, 380, 380, 380, 380, 700, 700]
},
{
name: '三年',
type: 'line',
data: [480, 480, 480, 480, 480, 800, 800]
},
{
name: '四年',
type: 'line',
data: [550, 550, 550, 550, 550, 900, 900]
},
{
name: '五年',
type: 'line',
data: [680, 680, 680, 680, 680, 1000, 1000]
}
]
};
if (option && typeof option === 'object') {
// 将配置应用到图表实例
myChart.setOption(option);
}
// 监听窗口的 resize 事件,实现了图表在窗口大小变化时的自适应调整
window.addEventListener('resize', myChart.resize);
</script>
</body>
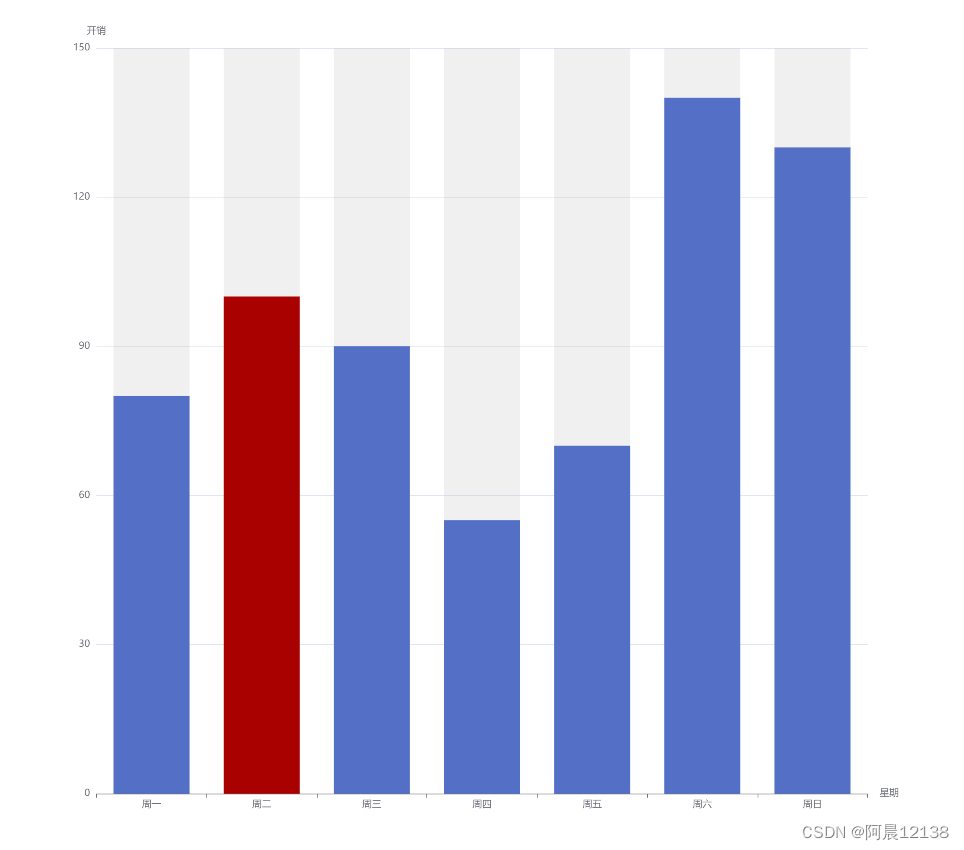
</html>基础柱状图
效果图:
代码:
<!DOCTYPE html>
<html lang="zh-CN">

<head>
  <meta charset="utf-8">
  <title>Basic Line Chart - Apache ECharts Demo</title>
  <style>
    * {
      margin: 0;
      padding: 0;
    }

    #chart-container {
      position: relative;
      height: 100vh;
      overflow: hidden;
    }
  </style>
</head>

<body>
  <div id="chart-container"></div>
  <script src="https://fastly.jsdelivr.net/npm/echarts@5.4.3/dist/echarts.min.js"></script>
  <script>
    var dom = document.getElementById('chart-container');
    // init 方法来初始化一个图表实例 myChart
    // 第一个参数 dom 是指定图表容器的 DOM 元素
    // 第二个参数 null 是可选的,表示指定的主题名称。这里传入 null 表示不使用任何主题,将使用默认主题
    // 第三个参数是一个配置对象,用于提供额外的配置选项
    var myChart = echarts.init(dom, null, {
      renderer: 'canvas',
      useDirtyRect: false
    });
    var app = {};

    var option;

    option = {
      xAxis: {
        type: 'category',
        data: ['周一', '周二', '周三', '周四', '周五', '周六', '周日'],
        name: "星期"
      },
      yAxis: {
        type: 'value',
        name: "开销"
      },
      series: [
        {
          //  数组中存放了对应 x 轴类目的数值数据
          data: [
            80,
            {
              value: 100,
              // itemStyle 属性指定了该数据点的颜色为 '#a90000'
              itemStyle: {
                color: '#a90000'
              }
            },
            90,
            55,
            70,
            140,
            130
          ],
          // 表示该系列使用柱状图进行展示
          type: 'bar',
          // 表示显示柱状图的背景。默认情况下,背景是透明的
          showBackground: true,
          // 定义了柱状图的背景样式
          backgroundStyle: {
            color: 'rgba(180, 180, 180, 0.2)'
          }
        }
      ]
    };

    if (option && typeof option === 'object') {
      // 将配置应用到图表实例
      myChart.setOption(option);
    }
    // 监听窗口的 resize 事件,实现了图表在窗口大小变化时的自适应调整
    window.addEventListener('resize', myChart.resize);
  </script>
</body>

</html>
折柱混合
效果图:

源代码:
<!DOCTYPE html>
<html lang="zh-CN">

<head>
  <meta charset="utf-8">
  <title>Basic Line Chart - Apache ECharts Demo</title>
  <style>
    * {
      margin: 0;
      padding: 0;
    }

    #chart-container {
      position: relative;
      height: 100vh;
      overflow: hidden;
    }
  </style>
</head>

<body>
  <div id="chart-container"></div>
  <script src="https://cdn.jsdelivr.net/npm/echarts@5.4.3/dist/echarts.min.js"></script>
  <script>
    var dom = document.getElementById('chart-container');
    // init 方法来初始化一个图表实例 myChart
    // 第一个参数 dom 是指定图表容器的 DOM 元素
    // 第二个参数 null 是可选的,表示指定的主题名称。这里传入 null 表示不使用任何主题,将使用默认主题
    // 第三个参数是一个配置对象,用于提供额外的配置选项
    var myChart = echarts.init(dom, null, {
      renderer: 'canvas',
      useDirtyRect: false
    });
    var app = {};

    var option;

    option = {
      // 定义了鼠标悬停在图表上时显示的提示框
      tooltip: {
        trigger: 'axis',
        axisPointer: {
          type: 'cross',
          crossStyle: {
            color: '#999'
          }
        }
      },
      // toolbox 属性定义了工具栏
      toolbox: {
        feature: {
          //  表示可以查看数据视图
          dataView: { show: true, readOnly: false },
          // magicType 表示可以切换不同的图表类型,包括线图和柱状图
          magicType: { show: true, type: ['line', 'bar'] },
          // 表示可以还原图表的初始状态
          restore: { show: true },
          // 表示可以保存图表为图片
          saveAsImage: { show: true }
        }
      },
      xAxis: [
        {
          type: 'category',
          data: ['周一', '周二', '周三', '周四', '周五', '周六', '周日'],
          axisPointer: {
            type: 'shadow'
          },
          name: "星期"
        }
      ],
      yAxis: [
        {
          type: 'value',
          name: '降水量',
          min: 0,
          max: 500,
          // 表示刻度间隔
          interval: 50,
          // 定义了坐标轴刻度上的文本显示格式
          axisLabel: {
            formatter: '{value} ml'
          }
        },
        {
          type: 'value',
          name: '温度',
          min: 0,
          max: 50,
          // 表示刻度间隔
          interval: 5,
          // 定义了坐标轴刻度上的文本显示格式
          axisLabel: {
            formatter: '{value} °C'
          }
        }
      ],
      series: [
        {
          name: '蒸发量',
          type: 'bar',
          tooltip: {
            // 定义了数值的格式化函数,分别将数值加上单位
            valueFormatter: function (value) {
              return value + ' ml';
            }
          },
          data: [
            2.0, 4.9, 7.0, 23.2, 25.6, 76.7, 135.6, 162.2, 32.6, 20.0, 6.4, 3.3
          ]
        },
        {
          name: '降水量',
          type: 'bar',
          tooltip: {
            valueFormatter: function (value) {
              return value + ' ml';
            }
          },
          data: [
            2.6, 5.9, 9.0, 26.4, 28.7, 70.7, 175.6, 182.2, 48.7, 18.8, 6.0, 2.3
          ]
        },
        {
          name: '温度',
          type: 'line',
          // 将某个系列数据与第二个 Y 轴关联起来,使该系列在第二个 Y 轴上显示
          yAxisIndex: 1,
          tooltip: {
            valueFormatter: function (value) {
              return value + ' °C';
            }
          },
          data: [2.0, 2.2, 3.3, 4.5, 6.3, 10.2, 20.3, 23.4, 23.0, 16.5, 12.0, 6.2]
        }
      ]
    };

    if (option && typeof option === 'object') {
      // 将配置应用到图表实例
      myChart.setOption(option);
    }
    // 监听窗口的 resize 事件,实现了图表在窗口大小变化时的自适应调整
    window.addEventListener('resize', myChart.resize);
  </script>
</body>

</html>
环形图
效果图:

源代码:
<!DOCTYPE html>
<html lang="zh-CN">

<head>
  <meta charset="utf-8">
  <title>Basic Line Chart - Apache ECharts Demo</title>
  <style>
    * {
      margin: 0;
      padding: 0;
    }

    #chart-container {
      position: relative;
      height: 100vh;
      overflow: hidden;
    }
  </style>
</head>

<body>
  <div id="chart-container"></div>
  <script src="./echarts.min.js"></script>
  <script>
    var dom = document.getElementById('chart-container');
    // init 方法来初始化一个图表实例 myChart
    // 第一个参数 dom 是指定图表容器的 DOM 元素
    // 第二个参数 null 是可选的,表示指定的主题名称。这里传入 null 表示不使用任何主题,将使用默认主题
    // 第三个参数是一个配置对象,用于提供额外的配置选项
    var myChart = echarts.init(dom, null, {
      renderer: 'canvas',
      useDirtyRect: false
    });
    var app = {};

    var option;

    option = {
      // 鼠标悬停在饼图扇区上时显示的提示框
      tooltip: {
        trigger: 'item'
      },
      legend: {
        top: '5%',
        left: 'center'
      },
      series: [
        {
          name: '饼图',
          type: 'pie',
          // 设置内外半径,即饼图的大小。内半径为 40%,外半径为 70%
          radius: ['40%', '70%'],
          // 不允许标签重叠
          avoidLabelOverlap: false,
          label: {
            position: 'outside',  // 设置标签位置为饼图对应的侧边
            fontSize: 12,  // 可选:调整标签字体大小
            fontWeight: 'bold'  // 可选:调整标签字体粗细
          },
          emphasis: {
            // 提示文本的样式配置
            label: {
              show: true,
              fontSize: 14,
              fontWeight: 'bold'
            }
          },
          labelLine: {
            show: false
          },
          data: [
            { value: 500, name: '周一的工作量' },
            { value: 60, name: '周二的工作量' },
            { value: 10, name: '周三的工作量' },
            { value: 410, name: '周四的工作量' },
            { value: 200, name: '周五的工作量' }
          ]
        }
      ]
    };

    if (option && typeof option === 'object') {
      // 将配置应用到图表实例
      myChart.setOption(option);
    }
    // 监听窗口的 resize 事件,实现了图表在窗口大小变化时的自适应调整
    window.addEventListener('resize', myChart.resize);
  </script>
</body>

</html>echarts文档:Examples - Apache ECharts
三个案例效果
序幕:
所展示示例使用到多个js库,例如:jquery、echarts、liMarquee等等,我是下载到了本地,其他小伙伴记得自己下载相关js库,或者引用线上库
推荐一个获取线上资源网站:BootCDN - Bootstrap 中文网开源项目免费 CDN 加速服务
第一个案例效果图:
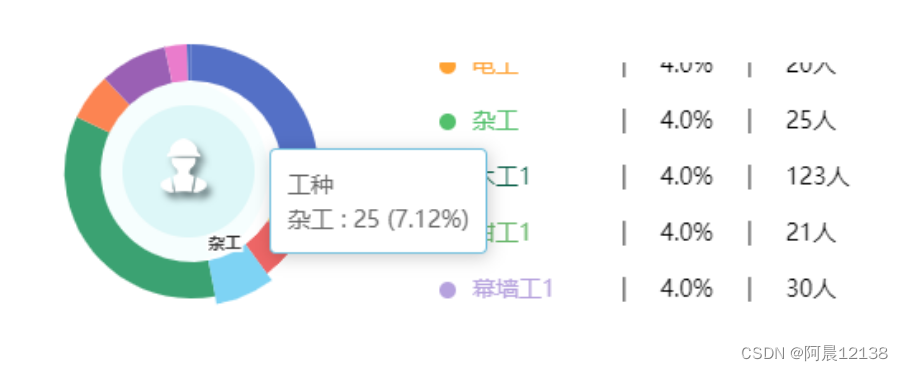
效果描述:左边数据用环形图表展示,右边以滚动列表的形式展示
源代码:
<!DOCTYPE html>
<html lang="en">

<head>
    <meta charset="UTF-8">
    <meta name="viewport" content="width=device-width, initial-scale=1.0">
    <title>Document</title>
    <link rel="stylesheet" type="text/css" href="./liMarquee.css">
    <style>
        .view-row {
            height: 23%;
            position: relative;
            margin-top: 20px;
        }

        .gongzhong {
            height: 175px;
        }

        .middle-ring {
            position: absolute;
            left: 274px;
            top: 65px;
            border-radius: 100px;
            width: 200px;
            height: 200px;
        }

        .middle-ring .ring1 {
            float: left;
            width: 111px;
            height: 111px;
            border-radius: 90px;
            background: rgb(80, 231, 235, 0.05);
        }

        .middle-ring .ring1 .ring2 .ring-icon {
            width: 100%;
            height: 100%;
            background: url(http://bs.nifengss.com/assets/themes/images/icon-gz.png) no-repeat center;
        }

        .middle-ring .ring1 .ring2 {
            margin: 10px;
            width: 80px;
            height: 80px;
            border-radius: 60px;
            background: rgb(0 188 193 / 10%);
            top: 5px;
            position: relative;
            left: 13px;
        }

        .ringData {
            height: 220px;
            width: 100%;
            position: absolute;
            left: 3%;
            top: 6%;
            margin: 10px auto;
        }

        .gongzhong .legeng {
            position: absolute;
            top: 40px;
            right: 18px;
            max-width: 280px;
            overflow: hidden;
            height: 170px;
            font-size: 14px;
            line-height: 34px;
        }

        .gongzhong .legeng .list {
            width: 280px;
            height: 170px;
            padding: 0;
        }

        .gongzhong .legeng .list li {
            overflow: hidden;
            display: flex;
        }

        /* 小圆点样式 */
        .gongzhong .legeng li span.yuan {
            display: inline-block;
            margin-top: 13px;
            width: 10px;
            height: 10px;
            border-radius: 5px;
            margin-right: 10px
        }

        /* 职位名称样式 */
        .gongzhong .legeng .col {
            display: inline-block;
            text-align: left;
            width: 70px;
            overflow: hidden;
            white-space: nowrap;
            text-overflow: ellipsis;
        }

        .gongzhong .legeng .gcol0 {
            color: #283d68;
        }

        .gongzhong .legeng .gcol1 {
            color: #ff5e33;
        }

        .gongzhong .legeng .gcol2 {
            color: #a16eba;
        }

        .gongzhong .legeng .gcol3 {
            color: #ffa233;
        }

        .gongzhong .legeng .gcol4 {
            color: #53c06c;
        }

        .gongzhong .legeng .gcol5 {
            color: #055c45;
        }

        .gongzhong .legeng .gcol6 {
            color: #6cb96e;
        }

        .gongzhong .legeng .gcol7 {
            color: #b6a2de;
        }

        .gongzhong .legeng .gcol8 {
            color: #5ab1ef;
        }

        .gongzhong .legeng .gcol9 {
            color: #ffb980;
        }

        .gongzhong .legeng .gcol10 {
            color: #7fe3c8;
        }

        .gongzhong .legeng .gcol11 {
            color: #044ed6;
        }

        .gongzhong .legeng .gcol12 {
            color: #15bc24;
        }

        .gongzhong .legeng .gcol13 {
            color: #bc9b15;
        }

        .gongzhong .legeng .gcol14 {
            color: #8d98b3;
        }

        .gongzhong .legeng .gcol15 {
            color: #e5cf0d;
        }

        .gongzhong .legeng .gcol16 {
            color: #97b552;
        }

        .gongzhong .legeng .gcol17 {
            color: #95706d;
        }

        .gongzhong .legeng .gcol18 {
            color: #dc69aa;
        }

        .gongzhong .legeng .gcol19 {
            color: #07a2a4;
        }

        .gongzhong .legeng .gcol20 {
            color: #9a7fd1;
        }

        .gongzhong .legeng .gcol21 {
            color: #588dd5;
        }

        .gongzhong .legeng .gcol22 {
            color: #f5994e;
        }

        .gongzhong .legeng .gcol23 {
            color: #c05050;
        }

        .gongzhong .legeng .gcol24 {
            color: #59678c;
        }

        .gongzhong .legeng .gcol25 {
            color: #c9ab00;
        }

        .gongzhong .legeng .gcol26 {
            color: #7eb00a;
        }

        .gongzhong .legeng .gcol27 {
            color: #6f5553;
        }

        .gongzhong .legeng .gcol28 {
            color: #c14089;
        }

        .gongzhong .legeng .gcol29 {
            color: #dd6b66;
        }

        .gongzhong .legeng .split {
            margin: 0 20px
        }

        .gongzhong .legeng .present {
            margin: 0px 0px 0 0px;
        }

        .gongzhong .legeng .gcolLine0 {
            background: #283d68;
        }

        .gongzhong .legeng .gcolLine1 {
            background: #ff5e33;
        }

        .gongzhong .legeng .gcolLine2 {
            background: #a16eba;
        }

        .gongzhong .legeng .gcolLine3 {
            background: #ffa233;
        }

        .gongzhong .legeng .gcolLine4 {
            background: #53c06c;
        }

        .gongzhong .legeng .gcolLine5 {
            background: #055c45;
        }

        .gongzhong .legeng .gcolLine6 {
            background: #6cb96e;
        }

        .gongzhong .legeng .gcolLine7 {
            background: #b6a2de;
        }

        .gongzhong .legeng .gcolLine8 {
            background: #5ab1ef;
        }

        .gongzhong .legeng .gcolLine9 {
            background: #ffb980;
        }

        .gongzhong .legeng .gcolLine10 {
            background: #7fe3c8;
        }

        .gongzhong .legeng .gcolLine11 {
            background: #044ed6;
        }

        .gongzhong .legeng .gcolLine12 {
            background: #15bc24;
        }

        .gongzhong .legeng .gcolLine13 {
            background: #bc9b15;
        }

        .gongzhong .legeng .gcolLine14 {
            background: #8d98b3;
        }

        .gongzhong .legeng .gcolLine15 {
            background: #e5cf0d;
        }

        .gongzhong .legeng .gcolLine16 {
            background: #97b552;
        }

        .gongzhong .legeng .gcolLine17 {
            background: #95706d;
        }

        .gongzhong .legeng .gcolLine18 {
            background: #dc69aa;
        }

        .gongzhong .legeng .gcolLine19 {
            background: #07a2a4;
        }

        .gongzhong .legeng .gcolLine20 {
            background: #9a7fd1;
        }

        .gongzhong .legeng .gcolLine21 {
            background: #588dd5;
        }

        .gongzhong .legeng .gcolLine22 {
            background: #f5994e;
        }

        .gongzhong .legeng .gcolLine23 {
            background: #c05050;
        }

        .gongzhong .legeng .gcolLine24 {
            background: #59678c;
        }

        .gongzhong .legeng .gcolLine25 {
            background: #c9ab00;
        }

        .gongzhong .legeng .gcolLine26 {
            background: #7eb00a;
        }

        .gongzhong .legeng .gcolLine27 {
            background: #6f5553;
        }

        .gongzhong .legeng .gcolLine28 {
            background: #c14089;
        }

        .gongzhong .legeng .gcolLine29 {
            background: #dd6b66;
        }
    </style>
</head>

<body>
    <div class="view-row">
        <div class="gongzhong">
            <!-- 环形图内的小图片 -->
            <div class="middle-ring">
                <div class="ring1">
                    <div class="ring2">
                        <div class="ring-icon"></div>
                    </div>
                </div>
            </div>
            <!-- 环形图 -->
            <div id="ringData" class="ringData"></div>
            <!-- 右侧的人员滚动 -->
            <div class="legeng gongZhongType">
                <ul class="list"></ul>
            </div>
        </div>
    </div>
    <script type="text/javascript" src="../js/jquery.min.js"></script>
    <!-- 人员滚动 -->
    <script type="text/javascript" src="./jquery.liMarquee.js"></script>
    <!-- 环形图 -->
    <script type="text/javascript" src="./echarts.min.js"></script>
    <script>
        var dataDate = [{ value: 80, name: '木工' }, { value: 10, name: '钳工' }, { value: 30, name: '幕墙工 ' }, { value: 20, name: '电工' }, { value: 25, name: '杂工' }, { value: 123, name: '木工1' }, { value: 21, name: '钳工1' }, { value: 30, name: '幕墙工1 ' }, { value: 10, name: '电工1' }, { value: 2, name: '杂工1' }]
        var jobClass = null
        var arrValue = null

        var ringData = function (dataJob, dataJobValue) {
            var myChart = echarts.init(document.getElementById('ringData'));
            // 指定图表的配置项和数据
            var option = {
                tooltip: { //提示框组件
                    trigger: 'item', //触发类型(饼状图片就是用这个)
                    formatter: "{a} <br/>{b} : {c} ({d}%)" //提示框浮层内容格式器
                },
                series: [ //系列列表
                    {
                        name: '工种',  //系列名称
                        type: 'pie',   //类型 pie表示饼图
                        center: ['40%', '45%'], //设置饼的原心坐标 不设置就会默认在中心的位置
                        radius: ['50%', '70%'],  //饼图的半径,第一项是内半径,第二项是外半径,内半径为0就是真的饼,不是环形
                        itemStyle: {  //图形样式
                            normal: { //normal 是图形在默认状态下的样式;emphasis 是图形在高亮状态下的样式,比如在鼠标悬浮或者图例联动高亮时。
                                label: {  //饼图图形上的文本标签
                                    show: false  //平常不显示
                                },
                                labelLine: {     //标签的视觉引导线样式
                                    show: false  //平常不显示
                                }
                            },
                            emphasis: {   //normal 是图形在默认状态下的样式;emphasis 是图形在高亮状态下的样式,比如在鼠标悬浮或者图例联动高亮时。
                                label: {  //饼图图形上的文本标签
                                    show: true,
                                    position: 'center',
                                    textStyle: {
                                        fontSize: '10',
                                        fontWeight: 'bold'
                                    }
                                }
                            }
                        },
                        data: dataJobValue
                    }
                ]
            };
            myChart.clear();
            myChart.setOption(option);
        };


        var workerNum = function () {
            // 2、工种占比分析
            var job = [];
            var arr = [];
            var htmlType = '';
            var arrList = dataDate;
            if (arrList.length > 0) {
                for (var i in arrList) {
                    var objList = { value: arrList[i].value, name: arrList[i].name };
                    //工种右边滚动
                    htmlType += '<li><span class="yuan gcolLine' + i + '"></span> <span class="gcol' + i + ' col">' + arrList[i].name + '</span><span class="split">|</span><span class="present"> 4.0%</span><span class="split">|</span><span>' + arrList[i].value + '人</span></li>';
                    job.push(arrList[i].name);
                    arr.push(objList);
                }
                jobClass = job;
                arrValue = arr;
                ringData(jobClass, arrValue);
            }
            var example = $('.gongZhongType .list');
            // 查找其中类名为 "str_origin" 的子元素,并获取它的 style 属性的值,赋值给变量 move_Pos
            // var move_Pos = example.find('.str_origin').attr('style');
            // example.attr('move_Pos', move_Pos)
            example.html(htmlType);
            if (htmlType == '') {
                jobClass = ["暂无数据"];
                arrValue = [{ value: 0, name: '暂无数据' }];
                $('.gongZhongType .list').html('<li style="margin-top: 60px;">暂无数据</li>');
                ringData(jobClass, arrValue);
            }
        };
        $(document).ready(function () {
            workerNum();
            setTimeout(function () {
                $('.gongZhongType .list').liMarquee({ direction: 'up', scrollamount: 20, runshort: false });
            }, 100);
        })

    </script>
</body>

</html>
第二个案例效果图:
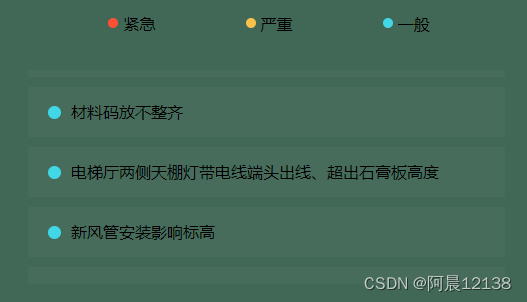

效果描述:下方的展示列表不停的滚动展示,鼠标悬浮时暂停滚动,移开又开始滚动
源代码:
<!DOCTYPE html>
<html lang="en">

<head>
    <meta charset="UTF-8">
    <meta name="viewport" content="width=device-width, initial-scale=1.0">
    <title>Document</title>
    <link rel="stylesheet" type="text/css" href="./liMarquee.css">
    <style>
        body {
            background-color: #416757;
        }

        ul.opacity li {
            background: url(http://bs.nifengss.com/assets/themes/images/transparent.png)
        }

        .show-tis3 {
            margin: 15px;
            display: flex;
            justify-content: space-evenly;
        }

        .show-tis2 span {
            float: left;
            padding: 0px 5px;
        }

        .show-tis2 span i {
            float: left;
            width: 10px;
            height: 10px;
            border-radius: 10px;
            margin: 5px;
        }

        .scroll-box {
            height: 230px;
            margin: 20px 20px;
            overflow: hidden;
            clear: both;
        }

        .scroll-box .opacity {
            overflow: hidden;
            height: 100%;
            padding: 0;
        }

        .scroll-box .opacity li {
            height: 50px;
            font-size: 16px;
            line-height: 50px;
            margin-bottom: 10px;
            padding: 0px 10px;
            overflow: hidden;
        }

        .scroll-box .opacity li .circular {
            float: left;
            width: 13px;
            height: 13px;
            background: #2e8ded;
            float: left;
            border-radius: 13px;
            margin: 18.5px 10px;
        }

        .scroll-box .opacity li span.s-text {
            min-width: 10px;
            max-width: 60%;
            overflow: hidden;
            white-space: nowrap;
            text-overflow: ellipsis;
        }

        .data-null {
            background: url("./data-null.png") no-repeat center;
        }

        .transparent {
            background: url("./transparent.png")
        }
    </style>
</head>

<body>
    <div class="c-main">
        <p class="show-tis2  show-tis3 findNotChangeSafety">
        </p>
        <div class="scroll-box legeng hiddenDanger">
            <ul class="opacity data-list">
            </ul>
        </div>
    </div>
    <script type="text/javascript" src="../js/jquery.min.js"></script>
    <!-- 人员滚动 -->
    <script type="text/javascript" src="./jquery.liMarquee.js"></script>
    <script>
        var colorAll = ["#ff5033", "#fbc14a", "#41d7e6", "#9f6ab4", "#d7ab82",
            "#ff9c33", '#50bf6d', '#b6a2de', '#5ab1ef',
            '#ffb980', '#7fe3c8', '#044ed6', '#15bc24', '#bc9b15',
            '#8d98b3', '#e5cf0d', '#97b552', '#95706d', '#dc69aa',
            '#07a2a4', '#9a7fd1', '#588dd5', '#f5994e', '#c05050',
            '#59678c', '#c9ab00', '#7eb00a', '#6f5553', '#c14089',
            '#dd6b66', '#759aa0', '#e69d87', '#8dc1a9', '#ea7e53',
            '#eedd78', '#73a373', '#73b9bc', '#7289ab', '#91ca8c',
            '#f49f42', '#d87c7c', '#919e8b', '#d7ab82', '#6e7074',
            '#61a0a8', '#efa18d', '#787464', '#cc7e63', '#724e58',
            '#4b565b', '#c12e34', '#e6b600', '#0098d9', '#2b821d',
            '#005eaa', '#339ca8', '#cda819', '#32a487', "#18ae86"];
        var findNotChangeSafety = function () {
            $(".hiddenDanger ul").html('');
            var htmlType = '';
            var row = '';
            // var data = { "safetyLevels": [{ "sort": "1", "name": "紧急", "value": "1" }, { "sort": "2", "name": "严重", "value": "2" }, { "sort": "3", "name": "一般", "value": "3" }], "noChangeSafetyList": [] }
            var data = { "safetyLevels": [{ "sort": "1", "name": "紧急", "value": "1" }, { "sort": "2", "name": "严重", "value": "2" }, { "sort": "3", "name": "一般", "value": "3" }], "noChangeSafetyList": [{ "levelName": "紧急", "safetyDescribe": "副龙骨此处未用整条,不锈钢灯槽边副龙骨软动", "isOutDate": "1", "sort": "1", "value": "1" }, { "levelName": "紧急", "safetyDescribe": "石膏板拼接未留缝隙,易产生开裂。", "isOutDate": "1", "sort": "1", "value": "1" }, { "levelName": "紧急", "safetyDescribe": "禁止使用拖线板", "isOutDate": "1", "sort": "1", "value": "1" }, { "levelName": "紧急", "safetyDescribe": "墙面上有黑胶点点", "isOutDate": "1", "sort": "1", "value": "1" }, { "levelName": "紧急", "safetyDescribe": "切割机未配备灭火器及挡火罩", "isOutDate": "1", "sort": "1", "value": "1" }, { "levelName": "紧急", "safetyDescribe": "钢架内侧未封板,影响施工防水。", "isOutDate": "1", "sort": "1", "value": "1" }, { "levelName": "紧急", "safetyDescribe": "电箱接线不规范存在乱接现象", "isOutDate": "1", "sort": "1", "value": "1" }, { "levelName": "严重", "safetyDescribe": "有缺陷的龙骨未充分利用", "isOutDate": "1", "sort": "2", "value": "2" }, { "levelName": "严重", "safetyDescribe": "夹板防腐防霉涂刷不到位", "isOutDate": "1", "sort": "2", "value": "2" }, { "levelName": "严重", "safetyDescribe": "卫生间墙面粉刷质量差、毛糙,无法做防水。", "isOutDate": "1", "sort": "2", "value": "2" }, { "levelName": "严重", "safetyDescribe": "施工垃圾未及时清理", "isOutDate": "1", "sort": "2", "value": "2" }, { "levelName": "严重", "safetyDescribe": "角落处小便现象严重", "isOutDate": "1", "sort": "2", "value": "2" }, { "levelName": "一般", "safetyDescribe": "材料码放不整齐", "isOutDate": "1", "sort": "3", "value": "3" }, { "levelName": "一般", "safetyDescribe": "电梯厅两侧天棚灯带电线端头出线、超出石膏板高度", "isOutDate": "1", "sort": "3", "value": "3" }, { "levelName": "一般", "safetyDescribe": "新风管安装影响标高", "isOutDate": "1", "sort": "3", "value": "3" }] }
            var noChangeSafetyList = data.noChangeSafetyList;
            var safetyLevels = data.safetyLevels;
            for (i in safetyLevels) {
                row += '<span class="st' + i + '"><i  style="background: ' + colorAll[i] + '"></i> ' + safetyLevels[i].name + '</span>';
                if (noChangeSafetyList.length > 0) {
                    for (var b in noChangeSafetyList) {
                        if (safetyLevels[i].value == noChangeSafetyList[b].value) {
                            if (noChangeSafetyList[b].isOutDate == 1) {
                                htmlType += '  <li><i class="circular" style="background:' + colorAll[i] + '"></i><span class="s-text" title="' + noChangeSafetyList[b].levelName + '">' + noChangeSafetyList[b].safetyDescribe + '</span></li>';
                            } else {
                                htmlType += '  <li><i class="circular" style="background:' + colorAll[i] + '"></i><span class="s-text" title="' + noChangeSafetyList[b].levelName + '">' + noChangeSafetyList[b].safetyDescribe + '</span></li>';
                            }
                        }
                    }
                    $('.hiddenDanger ul.data-list').removeClass("data-null");
                } else {
                    // 没有数据时显示的样式
                    $('.hiddenDanger').addClass("transparent");
                    $('.hiddenDanger ul.data-list').addClass("data-null");
                }
            }
            $(".findNotChangeSafety").html(row);
            $(".hiddenDanger ul").html(htmlType);
            setTimeout(function () {
                $(".hiddenDanger ul").liMarquee({ direction: 'up', scrollamount: 20, runshort: false });
            }, 80);

        }
        findNotChangeSafety()
    </script>
</body>

</html>
第三个案例效果图:
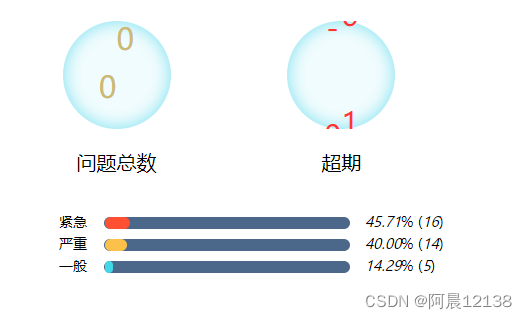
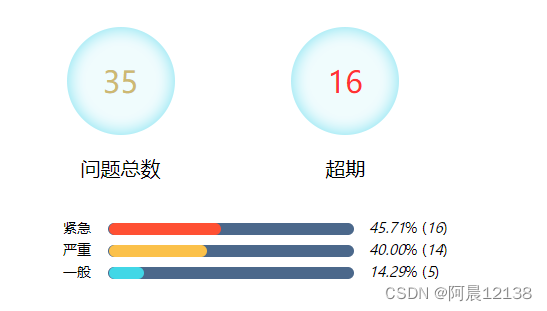
效果描述:数字先滚动,然后展示;进度条动态增长展示
源代码:
<!DOCTYPE html>
<html lang="en">

<head>
    <meta charset="UTF-8">
    <meta name="viewport" content="width=device-width, initial-scale=1.0">
    <title>Document</title>
    <link rel="stylesheet" type="text/css" href="./liMarquee.css">
    <style>
        .c-main {
            width: 42vw;
        }

        .total-num {
            display: flex;
        }

        .total-num .tal1 {
            width: 50%;
            height: 195px;
            text-align: center;
            font-size: 20px;
        }

        .total-num .tal1 .p-text {
            height: 108px;
            font-size: 30px;
            line-height: 108px;
            margin: 20px 0px;
        }

        .total-num .tal1 .text1 {
            color: #cdb972;
            background: url(http://bs.nifengss.com/assets/themes/images/safe/icon-img01.png) center no-repeat;
            overflow: hidden;
        }

        .total-num .tal1 .text2 {
            color: #ff3333;
            background: url(http://bs.nifengss.com/assets/themes/images/safe/icon-img01.png) center no-repeat;
            overflow: hidden;
        }

        .seep dl dd {
            overflow: hidden;
            font-size: 14px;
        }

        .seep dl dd span.span1 {
            margin-left: 15px;
            width: 30px;
            overflow: hidden;
            white-space: nowrap;
            text-overflow: ellipsis;
        }

        .seep dl dd div.skillbar {
            position: relative;
            float: left;
            margin: 5px 15px;
            width: 60%;
            height: 12px;
            border-radius: 12px;
            background: #4b688b;
        }

        .seep dl dd div.skillbar .filled {
            position: absolute;
            left: 1px;
            top: 0px;
            height: 12px;
            border-radius: 12px;
            background: url("http://bs.nifengss.com/assets/themes/images/icon-gz.png");
        }

        .seep dl dd span {
            float: left;
        }
    </style>
</head>

<body>
    <div class="c-main">
        <div class="total-num">
            <div class="tal1 fl">
                <p class="p-text text1 sum numberReload"></p>
                <p id="safProblemTotal">问题总数</p>
            </div>
            <div class="tal1 fl">
                <p class="p-text text2 outTime numberReload"></p>
                <p id="safExceed ">超期</p>
            </div>
        </div>
        <div class="seep seep-safe-num">
            <dl id="seep-num">
            </dl>
        </div>
    </div>
    <script type="text/javascript" src="../js/jquery.min.js"></script>
    <!-- 创建和展示技能条动画效果 用于进度条动态增长,然后展示-->
    <script type="text/javascript" src="./an-skill-bar.js"></script>
    <!-- 文字动画插件 用于文字翻滚、然后展示-->
    <script type="text/javascript" src="./jquery.leoTextAnimate.js"></script>
    <!-- 列表滚动 -->
    <script type="text/javascript" src="./jquery.liMarquee.js"></script>
    <script>
        var colorAll = ["#ff5033", "#fbc14a", "#41d7e6", "#9f6ab4", "#d7ab82",
            "#ff9c33", '#50bf6d', '#b6a2de', '#5ab1ef',
            '#ffb980', '#7fe3c8', '#044ed6', '#15bc24', '#bc9b15',
            '#8d98b3', '#e5cf0d', '#97b552', '#95706d', '#dc69aa',
            '#07a2a4', '#9a7fd1', '#588dd5', '#f5994e', '#c05050',
            '#59678c', '#c9ab00', '#7eb00a', '#6f5553', '#c14089',
            '#dd6b66', '#759aa0', '#e69d87', '#8dc1a9', '#ea7e53',
            '#eedd78', '#73a373', '#73b9bc', '#7289ab', '#91ca8c',
            '#f49f42', '#d87c7c', '#919e8b', '#d7ab82', '#6e7074',
            '#61a0a8', '#efa18d', '#787464', '#cc7e63', '#724e58',
            '#4b565b', '#c12e34', '#e6b600', '#0098d9', '#2b821d',
            '#005eaa', '#339ca8', '#cda819', '#32a487', "#18ae86"];
        /* 安全隐患数量 */
        var SafetyHazard = JSON.parse('{"safetyLevels":[{"sort":"1","name":"紧急","value":"1"},{"sort":"2","name":"严重","value":"2"},{"sort":"3","name":"一般","value":"3"}],"sum":35,"statisticsLeMessages":[{"levelPercentage":"45.71","levelNumber":"16","levelName":"紧急","sort":"1"},{"levelPercentage":"40.00","levelNumber":"14","levelName":"严重","sort":"2"},{"levelPercentage":"14.29","levelNumber":"5","levelName":"一般","sort":"3"}],"outTime":16}')
        var getStatisticsLevel = function () {
            console.log(123123)
            var data = SafetyHazard
            var html = '';
            var statisticsLeMessages = data.statisticsLeMessages;
            $(".levelUrgency").html(data.levelUrgencyNumber);
            $(".levelSeverity").html(data.levelSeverityNumber);
            $(".levelGeneral").html(data.levelGeneralNumber);
            $(".sum").html(data.sum);
            $(".outTime").html(data.outTime);
            if (statisticsLeMessages.length > 0) {
                for (i in statisticsLeMessages) {
                    html += '<dd>';
                    html += '<span class="span1" title="' + statisticsLeMessages[i].levelName + '">' + statisticsLeMessages[i].levelName + '</span>';
                    html += '<div class="span2 skillbar" >';
                    html += '<div class="filled filled' + i + '" style="background:' + colorAll[i] + ' " data-width="' + statisticsLeMessages[i].levelPercentage + '%"></div>';
                    html += '</div>';
                    html += '<span class="span3"><em  class="filled-text' + i + '">' + statisticsLeMessages[i].levelPercentage + '</em>% (<em class="levelUrgency">' + statisticsLeMessages[i].levelNumber + '</em>)</span>';
                    html += '</dd>';
                }
                $("#seep-num").html(html);

                //进度条样式
                $('.skillbar').skillbar({
                    speed: 1000,
                });
                $('.numberReload').leoTextAnimate({ fixed: [',', ':', '.'], start: '-' });
            }
            if (statisticsLeMessages.length > 3) {
                setTimeout(function () {
                    $("#seep-num").liMarquee({ direction: 'up', scrollamount: 10, runshort: false });
                }, 800);
            }
        };
        getStatisticsLevel()
    </script>
</body>

</html>


 446
446


 被折叠的 条评论
为什么被折叠?
被折叠的 条评论
为什么被折叠?
 到【灌水乐园】发言


