


首先,准备好我们的数据,三个tif图像。
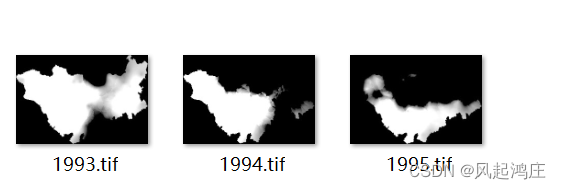
我们可以通过matlab逐像元读取tif图像,从而得到每个像素点的经纬度
info = geotiffinfo('1993.tif');
mat1993 = imread('1993.tif');
imshow('1993_12_.tif')
% 并行计算获取各格点经纬度
lat = zeros(size(mat1993,1),size(mat1993,2));
lon = zeros(size(mat1993,1),size(mat1993,2));
parfor i = 1 : size(mat1993,1)
    vlat = zeros(1, size(mat1993,2));
    vlon = zeros(1, size(mat1993,2));
    for j = 1 : size(mat1993,2)
        [x,y] = pix2map(info.RefMatrix, i, j);
        [vlat(j),vlon(j)] = projinv(info, x,y);
    end
    lat(i,:) = vlat;
    lon(i,:) = vlon;
end
我们现在面临两种选择,先进行每年的逐像元概率密度分析,后进行时间序列分析;还是进行三年的时间序列分析之后进行整体图像的概率密度分析。
matlab中的概率密度函数表示如下:
[f1,xi1] = ksdensity(x,y)如若我们按照第一种方法进行数据分析,我们发现每一张tif图像的像素都为233*346,通过上面的程序读取到每个像素点的经纬度后,我们对每个像素点进行了概率分析,并生成了xlsx文件(不能生成tif图像,会报错)
clc;%清理命令行窗口
clear all;%清理工作区
%读取excel数据,同目录下
tx=xlsread('lat.xlsx');
rx=xlsread('lon.xlsx');
result=zeros(233,346);
for i=1:346
    lation=tx(:,i);
    lontion=rx(:,i);
    x = lation;
    y= lontion;
    [f1,xi1] = ksdensity(x,y,'Support','positive');
    f1=f1*10^31;
    result(:,i)=f1;
    i=i+1;
end
xlswrite('数据表格.xlsx',result,'1')
%xlswrite('数据.tif',result)
得到的结果是一个表格,不过数据有问题
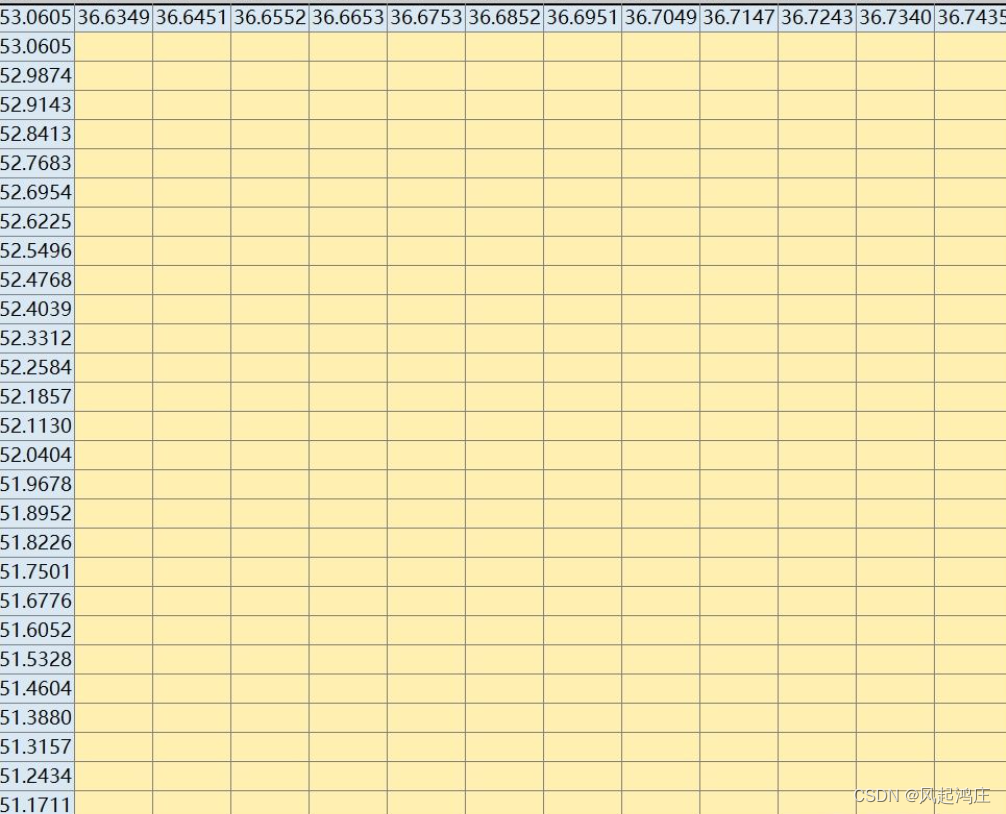
空的地方都表示NaN,错误的十分明显。
因此我们改变想法,先进行三年的时间序列分析,后进行这三年总体的概率密度分析
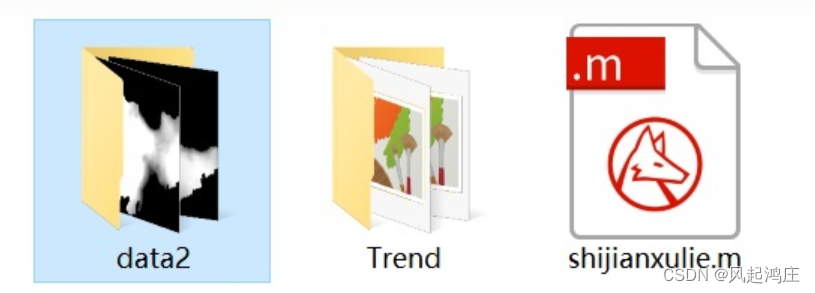
首先我们准备一个总的空文件夹,在里面建立Trend,data空文件夹,我们的.m文件也放置于此。
然后我们读取这三年的tif文件,并进行一元线性回归与概率密度分析,去趋势分析其实也和这个代码结构大致相似。其中概率密度分析代码如下:
tic;
clc;
clear;

s1 = 'data2\1993.tif';% 栅格数据存储在sm文件夹下
[A,R] = geotiffread(s1);
info = geotiffinfo(s1);%获取坐标系信息

x = (1:3);           %自变量
[row,col] = size(A);  %行列数

M = zeros(3,row,col)+NaN; %建立空数据立方体

%将时间序列数据读入空数据立方体
for year = 1993:1995
    s2 = ['data2\',int2str(year),'.tif'];
    d = geotiffread(s2);
    d(d<-200) = NaN;   % 本数据的填充值为负数,所以要去掉填充值,不然会参与运算因此在计算之前要先查看

    M(year-1992,:,:) = d;% 年份放在第一个位置
end

Slope = zeros(row,col);     % 预先建立斜率空数组
Rsq = zeros(row,col);       % R2
Pvalue = zeros(row,col)+1;  % P值
B = zeros(row,col);         % 截距
Density=zeros(row,col);     %概率密度
%一元线性回归
for i = 1:row
    for j = 1:col
        Y = M(:,i,j);%因变量
        X = [ones(length(Y),1),x'];%自变量
        [b,bint,r,rint,stats] = regress(Y,X);
        Pvalue(i,j) = stats(3); %P值
        Slope(i,j) = b(2);      %斜率
        B(i,j) = b(1);          %截距
        Rsq(i,j) = stats(1);    %R2
        [f,xi1] = ksdensity(i,j,'Support','positive');
        Density(i,j)=f(1);%概率密度
    end
disp(row);
end

Slope(isnan(Slope)) = 0;
Rsq(isnan(Rsq)) = 0;
Density(isnan(Density)) = 0;
Pvalue(isnan(Pvalue)) = 1;  %替换空值

%设置存储路径
f1 = 'Trend\Slope.tif';%
f2 = 'Trend\Pvalue.tif';
f3 = 'Trend\Rsq.tif';
f4 = 'Trend\B.tif';
f5= 'Trend\Density.tif';

%导出数据
geotiffwrite(f1,Slope,R,'GeoKeyDirectoryTag',info.GeoTIFFTags.GeoKeyDirectoryTag);
geotiffwrite(f2,Pvalue,R,'GeoKeyDirectoryTag',info.GeoTIFFTags.GeoKeyDirectoryTag);
geotiffwrite(f3,Rsq,R,'GeoKeyDirectoryTag',info.GeoTIFFTags.GeoKeyDirectoryTag);
geotiffwrite(f4,B,R,'GeoKeyDirectoryTag',info.GeoTIFFTags.GeoKeyDirectoryTag);
geotiffwrite(f5,Density,R,'GeoKeyDirectoryTag',info.GeoTIFFTags.GeoKeyDirectoryTag);
toc;
去趋势分析代码如下,我对这三年的趋势进行了去趋势分析:
tic;
clc;
clear;

s1 = 'data1\1995.tif';% 栅格数据存储在sm文件夹下
[A,R] = geotiffread(s1);
info = geotiffinfo(s1);%获取坐标系信息

x = (1:3);           %自变量
[row,col] = size(A);  %行列数

M = zeros(3,row,col)+NaN; %建立空数据立方体

%将时间序列数据读入空数据立方体
for year = 1995:1997
    s2 = ['data1\',int2str(year),'.tif'];
    d = geotiffread(s2);
    d(d<-200) = NaN;   % 本数据的填充值为负数,所以要去掉填充值,不然会参与运算因此在计算之前要先查看

    M(year-1994,:,:) = d;% 年份放在第一个位置
end

trend_after = zeros(row,col);  % 去趋势(现在)
%去趋势分析(用的回归函数之后对函数去趋势分析)
for i = 1:row
    for j = 1:col
        Y = M(:,i,j);%因变量
        X = [ones(length(Y),1),x'];%自变量
        b=regress(Y,X);
        detrend_after = detrend(b);
        trend_after(i,j)=mean(detrend_after);
    end
disp(row);
end

trend_after(isnan(trend_after)) = 0;
%设置存储路径
f2 = 'Trend\trend_after.tif';


%导出数据
geotiffwrite(f2,trend_after,R,'GeoKeyDirectoryTag',info.GeoTIFFTags.GeoKeyDirectoryTag);
toc;
其实也想用python做一下时间序列,但是发现result数组存进去就一直是空值,所以没有成功做出来。欢迎评论区告诉我这是怎么一回事
有问题地方的代码如下:
# ******************时间序列运算开始的地方**********************#
        # 就是这个地方result没有值!数组存不进去!坑爹!!!!!
        # 此处可以添加判断条件和运算规则
        a = time_series_list[1]
        b = time_series_list[2]
        result[x, y] = a
        result2[x, y] = b
总代码如下:
import numpy as np
import os
import rasterio as ras
import pandas as pd


def time_series_test(inputpath, outputPath):
    # inputpath:影像的存储路径
    # outputPath:影像的保存路径

    filepaths = []
    for file in os.listdir(inputpath):
        filepath1 = os.path.join(inputpath, file)
        filepaths.append(filepath1)

    # 获取影像数量
    num_images = len(filepaths)

    # 读取影像数据
    img1 = ras.open(filepaths[0])

    # 获取影像的投影,高度和宽度
    transform1=img1.transform
    height1 = img1.height
    width1 = img1.width
    array1 = img1.read()
    img1.close()

    # 读取所有影像
    for path1 in filepaths[0:]:
        if path1[-4:] == '.tif':
            print(path1)
            img2 = ras.open(path1)
            array2 = img2.read()
            array1 = np.vstack((array1, array2))
            img2.close()

    nums, width, height = array1.shape
    print(width, height)

    # 写影像
    def writeImage(outputPath, height1, width1, para_array, bandDes, transform1):
        with ras.open(
                outputPath,
                'w',
                driver='GTiff',
                height=height1,
                width=width1,
                count=1,
                dtype=para_array.dtype,
                crs='+proj=latlong',
                transform=transform1,
        ) as dst:
            dst.write_band(1, para_array)
            dst.set_band_description(1, bandDes)
        del dst

    # 定义一个输出列表,将结果保存在列表,再转换为矩阵,否则根本输入不了数据,都是0.。。。
    result = np.zeros([width, height])
    result2 = np.zeros([width, height])

    # 只有有值的区域才进行时间序列计算
    c1 = np.isnan(array1)
    sum_array1 = np.sum(c1, axis=0)
    nan_positions = np.where(sum_array1 == num_images)
    positions = np.where(sum_array1 != num_images)

    # 输出总像元数量
    print("all the pixel counts are {0}".format(len(positions[0])))


    # 时间序列运算
    for i in range(len(positions[0])):
        # print(i)
        x = positions[0][i]#根据每个经度进行时间序列数据生成
        y = positions[1][i]#根据每个纬度进行时间序列数据生成
        time_series_list = array1[:, x, y]
        # 打印每一条时间序列
        #print(array1[:, x, y], "time_series_list")
        # ******************时间序列运算开始的地方**********************#
        # 就是这个地方result没有值!数组存不进去!坑爹!!!!!
        # 此处可以添加判断条件和运算规则
        a = time_series_list[1]
        b = time_series_list[2]
        result[x, y] = a
        result2[x, y] = b


    # 处理列表,换为数组
    '''result = np.array(list1)
    result2=np.array(list2)
    num = 233 # 定义每组包含的元素个数

    def lstg(num, list1):
        for i in range(0, len(list1), num):
            yield list1[i:i + num]

    lstgs = lstg(num, list1)

    for i in lstgs:
        print(i)'''


        # ******************时间序列运算结束的地方**********************#

    # 将数组结果保存成影像

    all_array = [result, result2]
    result_save_path = os.path.join(outputPath, "result.tif")
    result2_save_path = os.path.join(outputPath, "result2.tif")

    image_save_paths = [result_save_path, result2_save_path]
    band_Des = ['result', 'result2']
    for i in range(len(all_array)):
        writeImage(image_save_paths[i], height1, width1, all_array[i], band_Des[i], transform1)

if __name__=="__main__":
    # 数据输入路径
    input_path = r"D:\data3"
    # 结果数据保存路径
    output_path = r"D:\data3\jieguo"
    # 运行程序
    time_series_test(input_path, output_path)
注:因为我并不是大气科学和地理专业的学生,所以可能不懂需求,结果也有所偏差。做这个其实是因为闲鱼接了一单,结果我东西做完了,他倒是说结果不对,拖欠钱款。我最后索性将代码开源,希望可以帮助到更多的人。
数据分析的活真的好跳脱:)
以上,还望各位多多指正。


 3220
3220


 被折叠的 条评论
为什么被折叠?
被折叠的 条评论
为什么被折叠?
 到【灌水乐园】发言


