


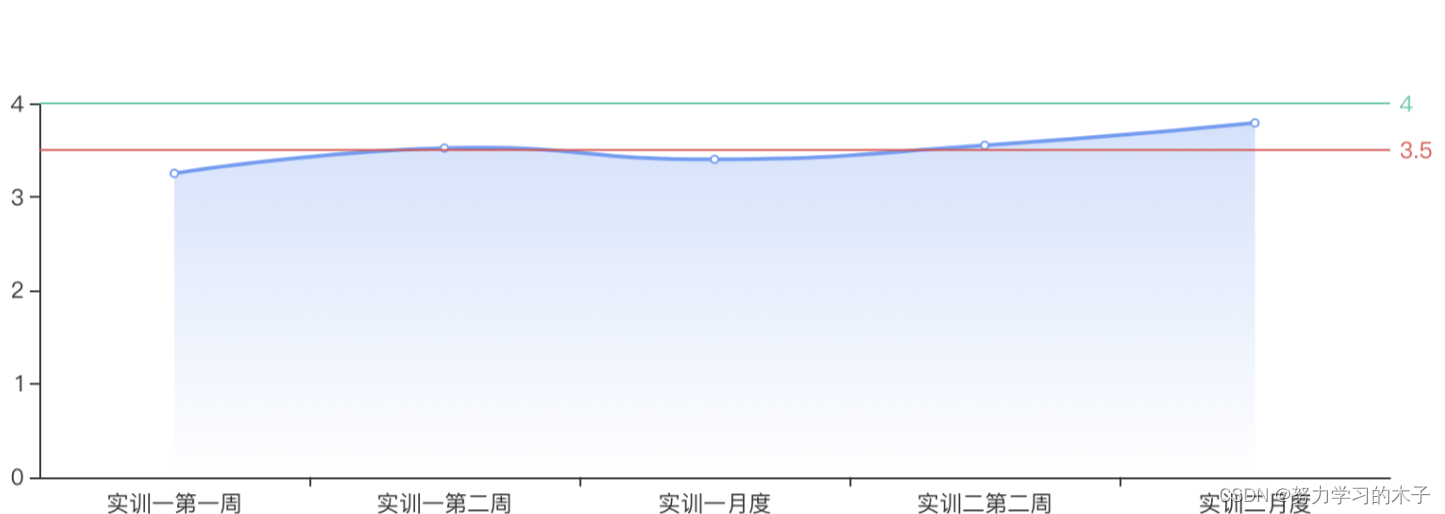
折线图
如图:
1.title
title:设置图标标题
- text:标题名称
- left:标题定位方向
- top、left:定位
- textStyle:标题样式
- color:标题颜色
   title: {
        text: '答辩评分趋势',
        left: 'left',
        top: 20,
        left: 20,
        textStyle: {
            color: '#679CF6'
             }
       }
2.tooltip
tooltip:提示框
- trigger:触发类型(axis:鼠标触摸到轴触发,item:鼠标触摸到折线点触发)
- showDelay:添加延迟时间,避免来回切换(单位ms)
- axisPointer:坐标轴指示器,坐标轴触发有效
- type:line/shadow(默认line,设置shadow时鼠标放上去有阴影)
- shadowStyle:当设置值为shadow时,
   tooltip: {
             trigger: 'axis',
             // 显示延迟,添加显示延迟可以避免频繁切换,单位ms
             showDelay: 200,
             // 坐标轴指示器,坐标轴触发有效
             axisPointer: {
                  // 默认为直线,可选为:'line' | 'shadow'
                  type: 'show',
                  shadowStyle: {
                          shadowBlur: 1,
                          opacity: 0.3
                              }
                     },
           },
3.grid
grid:图表距离容器的位置
 grid: {
          left: '4%',
          right: '4%',
          bottom: '4%',
          top: '30%',
          containLabel: true
     },
4.legend
legend:图例
- data:图例的具体文字
- textStyle:图例的文字
- icon:图例的形状 (包括:circle,rect ,roundRect,triangle,diamond,pin,arrow,none)
  legend: {
         data: ['xx', 'xx', 'xx', 'xx'],
         right: '33%',
         top: '10%',
         textStyle: {
                 fontSize: 12,
                 color: '#666'
        },
           icon: "circle",
           itemWidth: 10,  // 设置宽度
           itemHeight: 10, // 设置高度
           itemGap: 40 // 设置间距
     },
5.xAxis
xAxis :x轴设置
name:单位
splitLine:网格线
show:false (去除网格线)
data:x轴坐标显示的数据,数组类型
axisLine:设置x轴的轴线
show:true(设置显示)
lineStyle:设置轴线的样式
color:颜色
width:宽度
type:线条类型
- axisLabel:设置x轴文字样式
  - textStyle:文字样式,对象类型
    - show:是否展示
    - fontSize:字体大小
    - color:文字颜色
  - formatter:自定义文字,后面跟一个函数,默认会一个参数,x坐标的值
6.yAxis
- yAxis:与x轴基本同理
7.series
series:图标系列,对象类型
type:line(图标类型为线性图标)
smooth:true(设置折线为光滑)
name:图标名称
areaStyle:图标区域的样式(本文中的图标设置的为渐进色)
data:图标的数据
markLine:基线
symbol:none(去掉基线的箭头)
lable:基线的文字设置
position:基线文字位置(start,middle,end)
show:是否显示基线文字
formatter:基线文字内容
data:设置基线(Array类型)
silent:鼠标悬停(true/false)
lineStyle:基线线条设置,对象类型
type:solid(基线线条类型)
color:基线线条颜色
yAxis:y轴基线的值


 1518
1518


 被折叠的 条评论
为什么被折叠?
被折叠的 条评论
为什么被折叠?
 到【灌水乐园】发言


