


追求系列化、高质量的R语言教程
上篇介绍了在ggplot2系统下定义一个简单函数的方法,本篇继续介绍参数的定义方法。
本篇目录如下:
前情回顾
StepLine对象
stat_stepline函数
使用示例
setup_params方法
前情回顾
上篇中定义新函数的全部代码如下:
library(ggplot2)
## 定义Stat*对象
StepArea <- ggproto("StepArea", Stat,
    required_aes = c("x", "y"),

    compute_group = function(data, scales) {
      n = dim(data)[1]
      data.frame(xmin = data$x[1:(n-1)],
                 xmax = data$x[2:n],
                 ymin = 0,
                 ymax = data$y[1:(n-1)])
    }
)

## 定义stat_*函数
stat_steparea <- function(mapping = NULL, data = NULL, geom = "rect",
                          position = "identity", na.rm = FALSE, show.legend = NA,
                          inherit.aes = TRUE, ...) {

  layer(
    stat = StepArea, data = data, mapping = mapping, geom = geom,
    position = position, show.legend = show.legend, inherit.aes = inherit.aes,
    params = list(na.rm = na.rm, ...)
  )
}上篇也提到了,新函数会继承geom参数所对应几何图形函数的参数,而新参数则需要自定义。
StepLine对象
在StepArea对象中,我们通过compute_group方法从输入数据中计算得到xmin、xmax、ymin、ymax四个新变量用于绘制矩形块(标红代码部分)。
在本篇,我们通过compute_group方法从输入数据计算得到x和y变量来定义一个StepLine对象:
StepLine <- ggproto("StepLine", Stat,
    required_aes = c("x", "y"),

    compute_group = function(data, scales, type) {
      n = dim(data)[1]
      data = data[order(data$x, data$y, decreasing = c(0,1)), ]
      x = rep(data$x, each = 2)
      y = rep(data$y, each = 2)
      if (type == 1) {x = x[2:(2*n)]; y = y[1:(2*n-1)]}
      if (type == 2) {y = y[2:(2*n)]; x = x[1:(2*n-1)]}
      data.frame(x = x, y = y)
    }
)在这里,我们使用type参数来控制阶梯线的形状(相关代码已标红):当type = 1时使用」或﹁连接相邻点(先水平后垂直);当type = 2时使用﹂或「连接相邻点(先垂直后水平)。
stat_stepline函数
接下来,我们再定义stat_stepline()函数并把type作为它的参数(相关代码已标红):
stat_stepline <- function(mapping = NULL, data = NULL, geom = "line",
                          position = "identity", na.rm = FALSE, show.legend = NA,
                          inherit.aes = TRUE, type = NULL, ...) {

  layer(
    stat = StepLine, data = data, mapping = mapping, geom = geom,
    position = position, show.legend = show.legend, inherit.aes = inherit.aes,
    params = list(na.rm = na.rm, type = type, ...)
  )
}
使用示例
对比两种type取值的效果:
set.seed(0922)
data = data.frame(x = 1:10, y = rpois(10,5))

ggplot(data, aes(x, y)) +
  stat_stepline(type = 1, col = "red") +
  stat_stepline(type = 2, col = "blue", linetype= 2)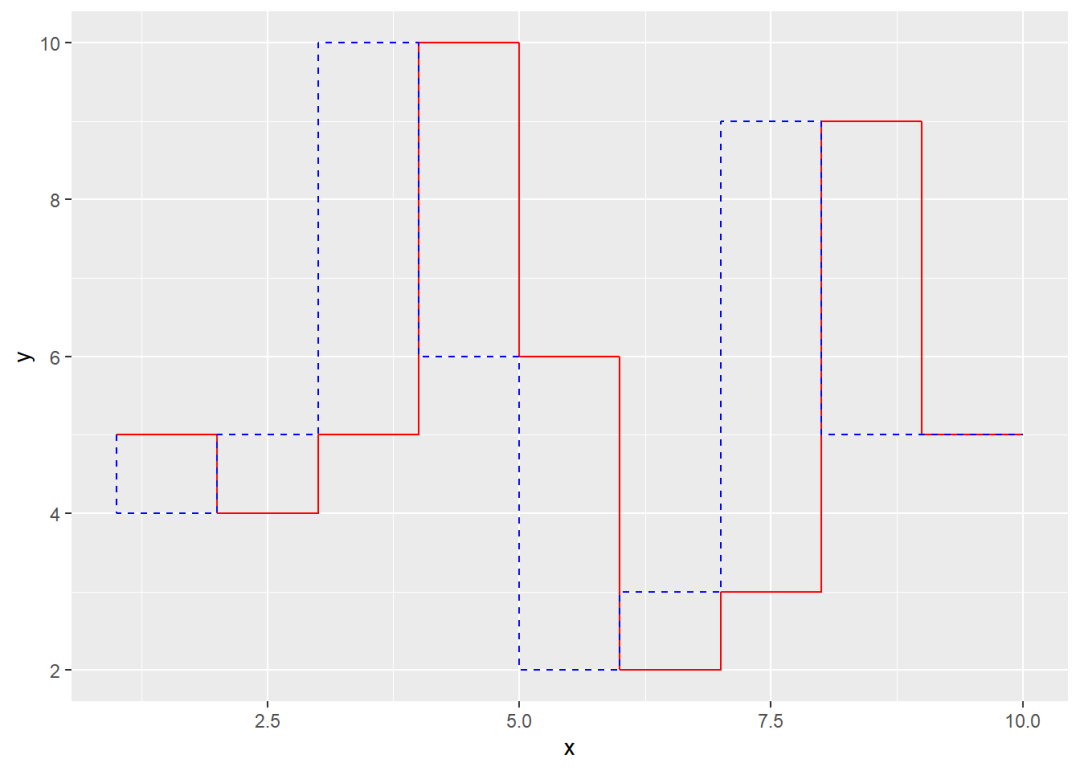
stat_stepline()函数默认使用geom = "line",和其统计变换函数一样,该参数可以更换:
ggplot(data, aes(x, y)) +
  stat_stepline(type = 2, geom = "area",
                fill = "blue", alpha = 0.5) +
  geom_point()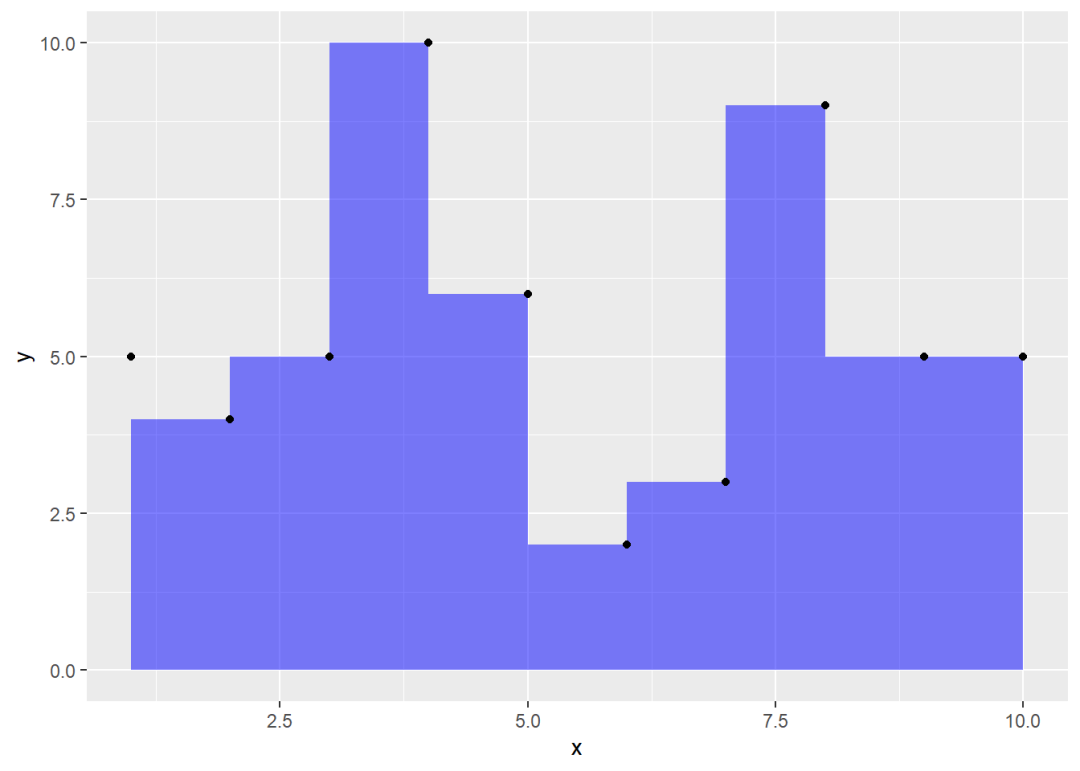
setup_params方法
在Stat对象的方法中,setup_params方法可以用来设置参数的默认值。假设在用户未指定type参数时,若数据样本在15以下,则默认type = 1;否则默认type = 2;若用户指定了type参数则遵循用户选择。
据此,我们可以修改StepLine对象的setup_params方法(相关代码已标红):
StepLine <- ggproto("StepLine", Stat,
    required_aes = c("x", "y"),

      setup_params = function(data, params) {
        if (!is.null(params$type))
          return(params)

        n = dim(data)[1]
        if (n < 15) params$type = 1 else
          params$type = 2
        return(params)
      },

    compute_group = function(data, scales, type) {
      n = dim(data)[1]
      data = data[order(data$x, data$y, decreasing = c(0,1)), ]
      x = rep(data$x, each = 2)
      y = rep(data$y, each = 2)
      if (type == 1) {x = x[2:(2*n)]; y = y[1:(2*n-1)]}
      if (type == 2) {y = y[2:(2*n)]; x = x[1:(2*n-1)]}
      data.frame(x = x, y = y)
    }
)在更改StepLine后,无需通过运行stat_stepline()的定义代码来更新函数,因为它会自动更新(面对对象的编程的特点)。
上面使用的示例数据data的样本数为10,因此type默认值应为1:
ggplot(data, aes(x, y)) +
  stat_stepline() +
  geom_point()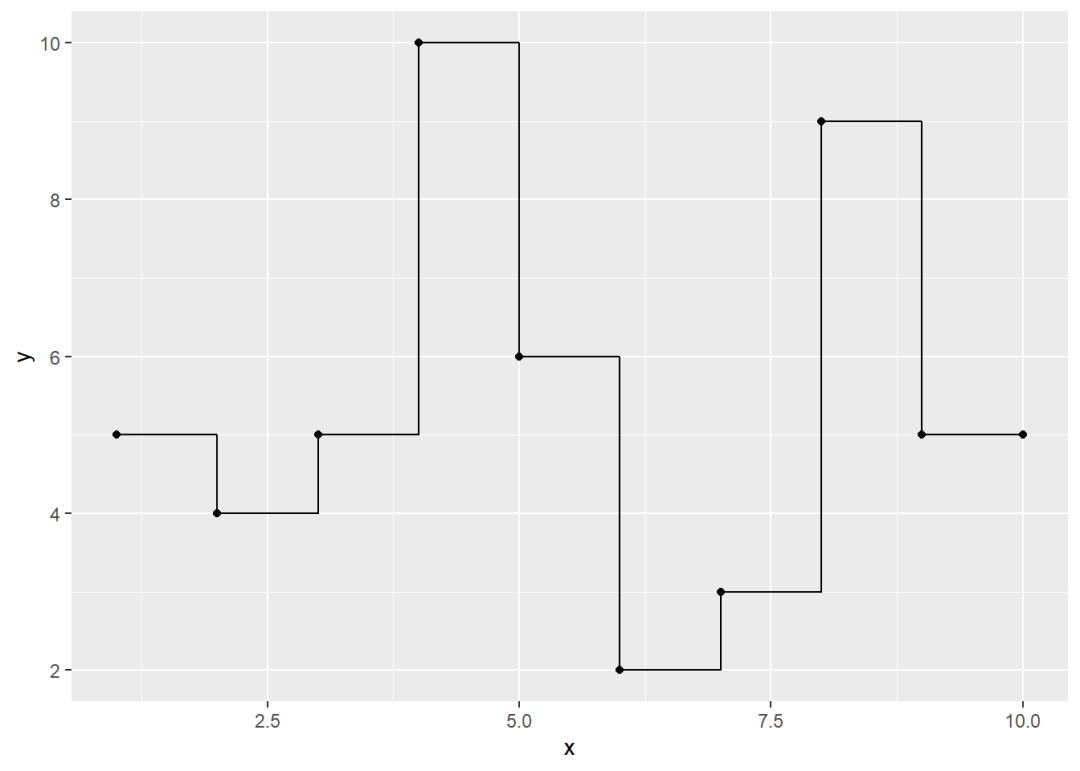
再定义一个样本数为20的data2作为示例数据,其默认值应为2:
set.seed(0922)
data = data.frame(x = 1:20, y = rpois(20,5))

ggplot(data, aes(x, y)) +
  stat_stepline() +
  geom_point()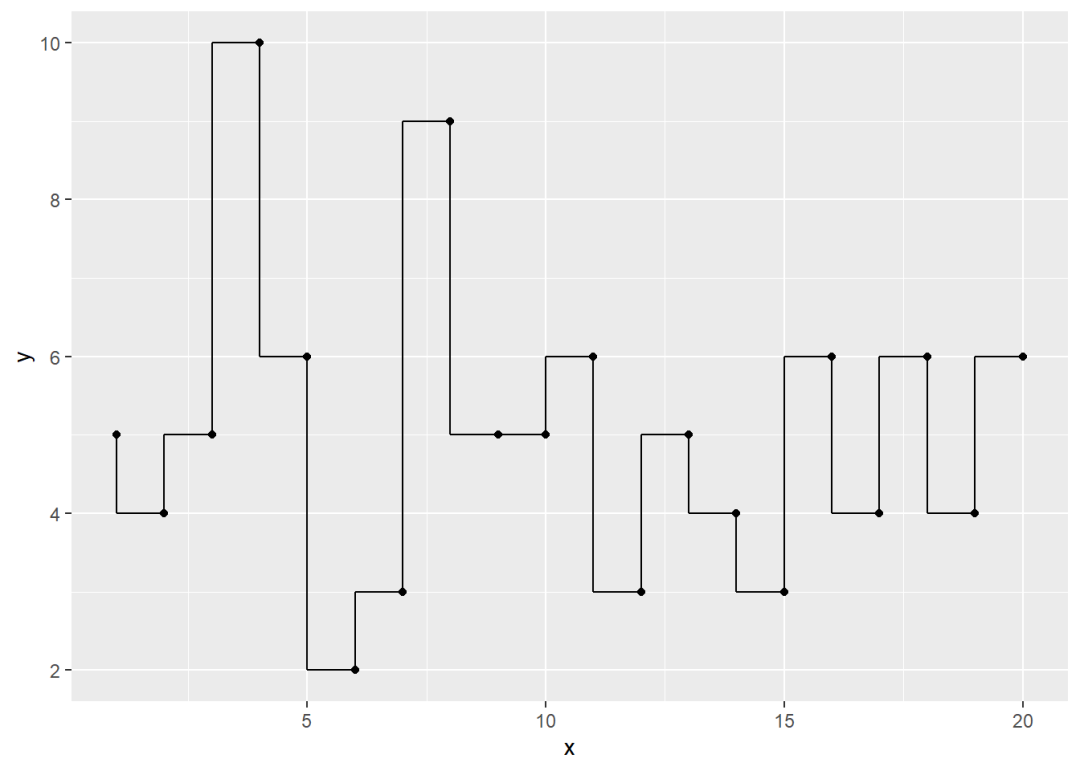


 346
346


 被折叠的 条评论
为什么被折叠?
被折叠的 条评论
为什么被折叠?
 到【灌水乐园】发言


