


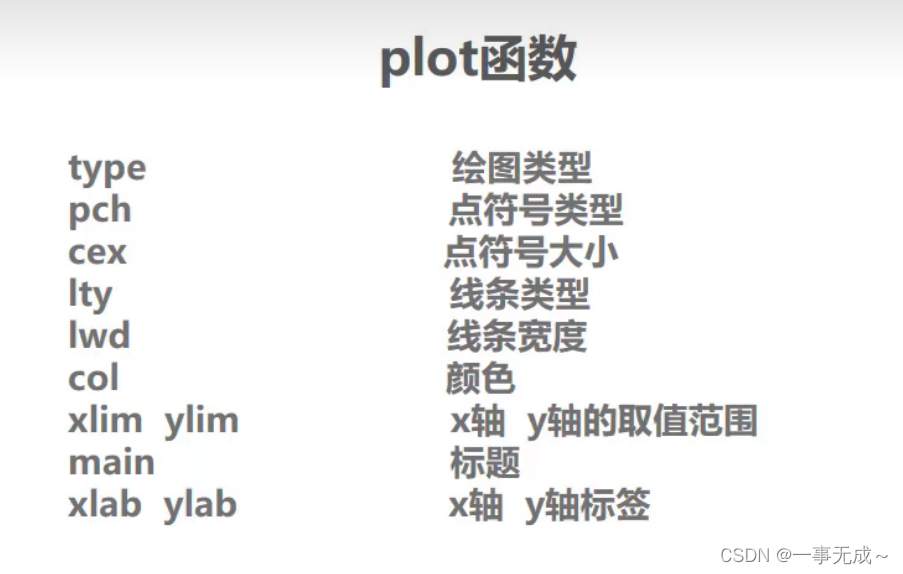
目录
plot函数:
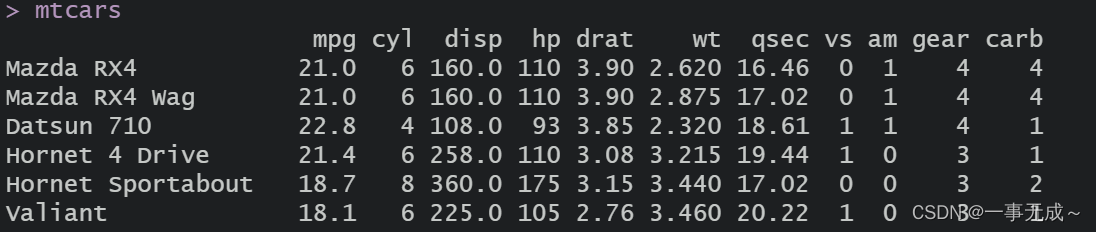
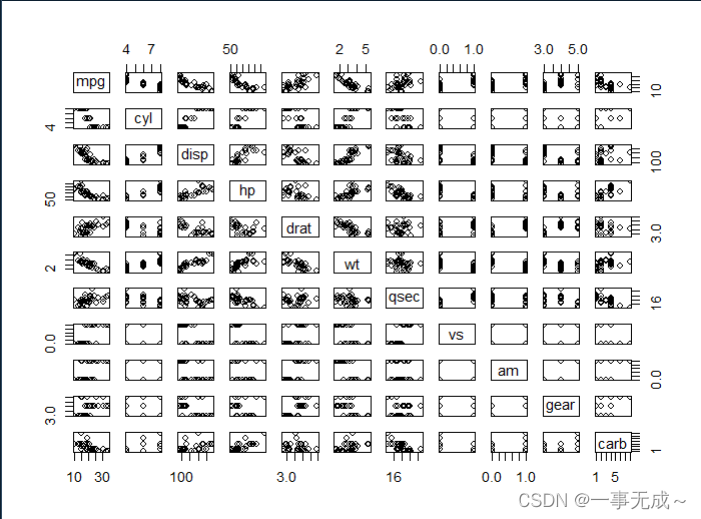
mtcars是一个内置的演示用的数据集,方便用户直接拿这些示例数据试验某些作图功能,下面使用mtcars作图演示。
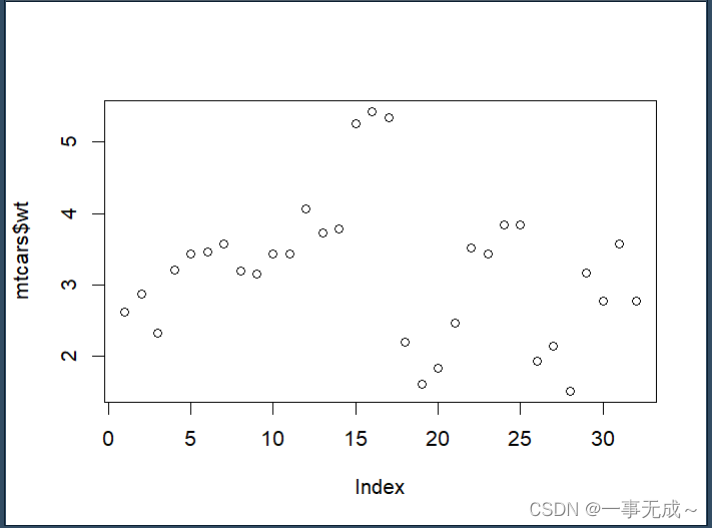
plot(mtcars$wt)
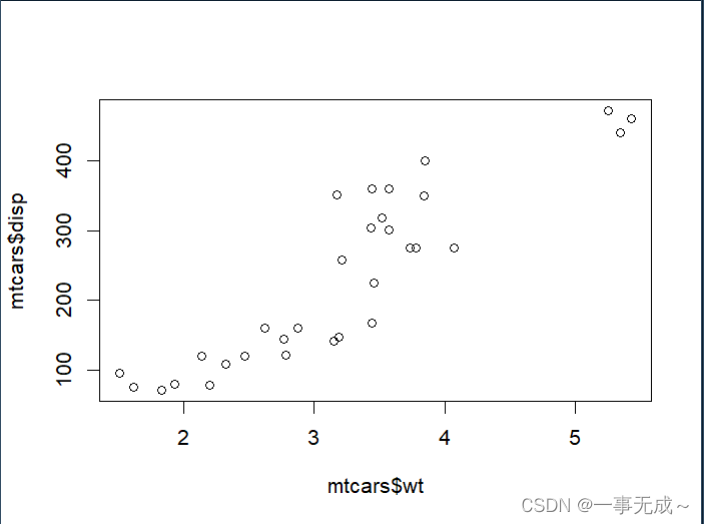
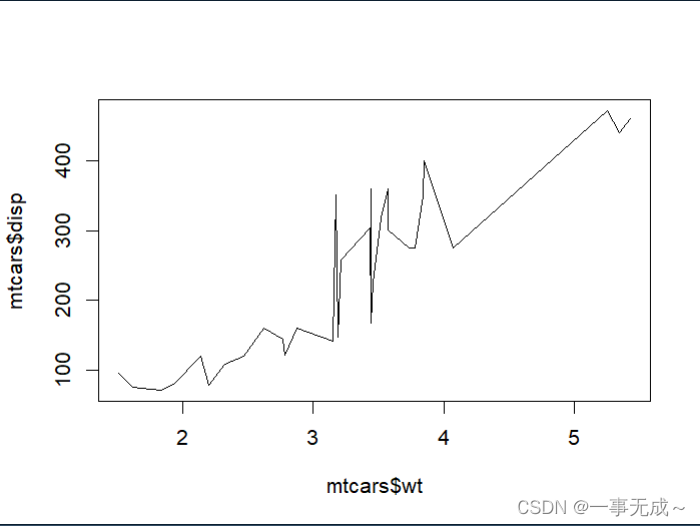
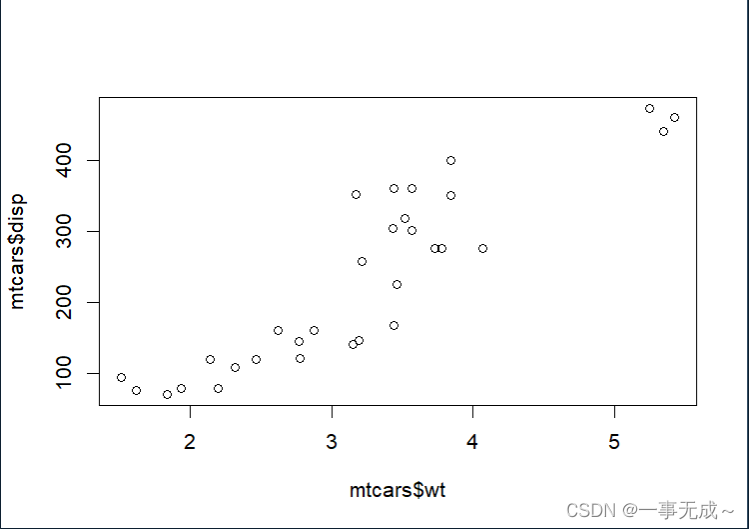
plot(mtcars$wt,mtcars$disp)
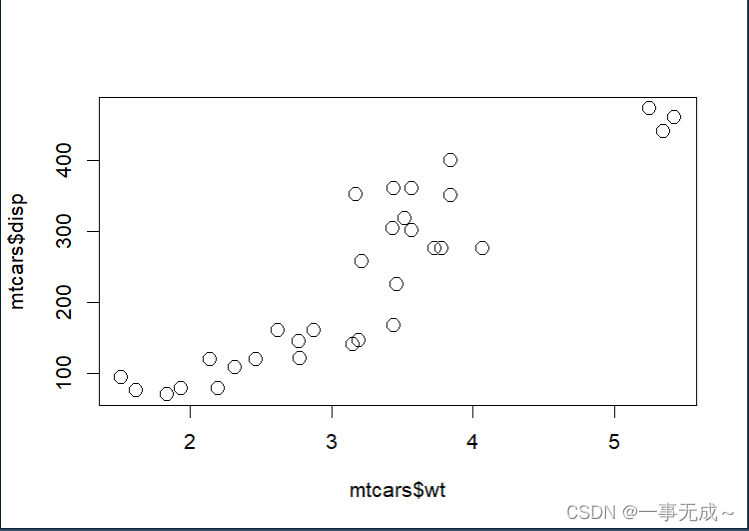
plot(mtcars)
type绘图类型
p表示点,l表示线,b表示下划线,其他o,h,s,S
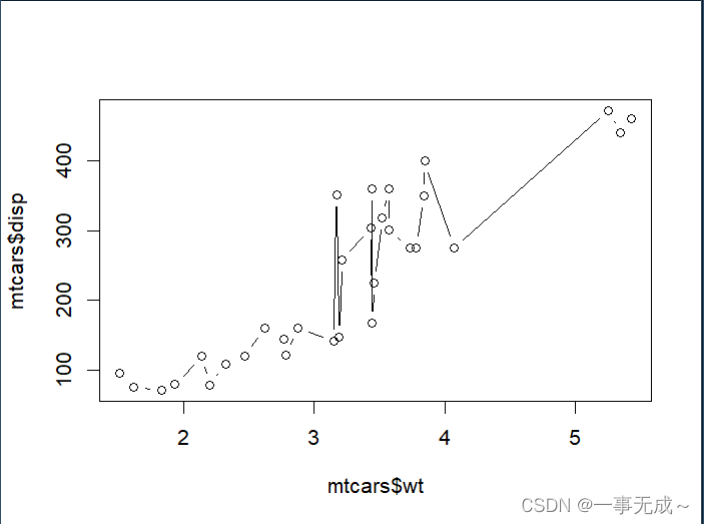
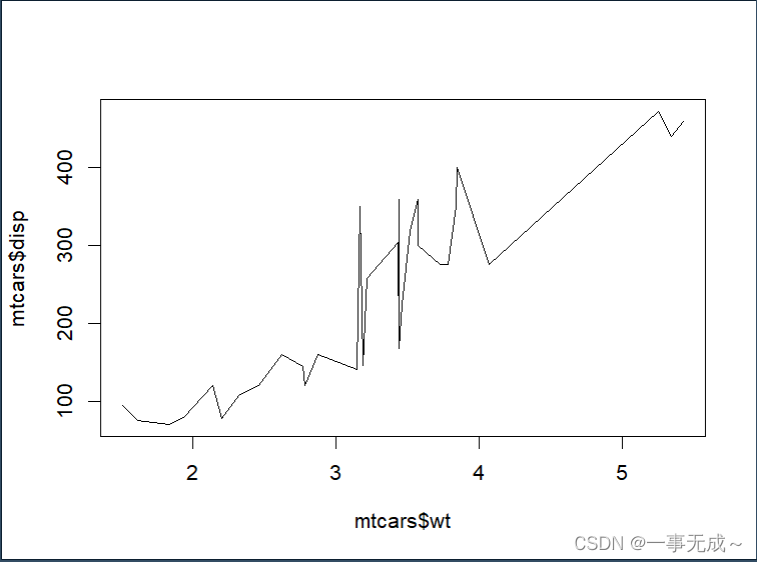
mtcars<-mtcars[order(mtcars$wt),]
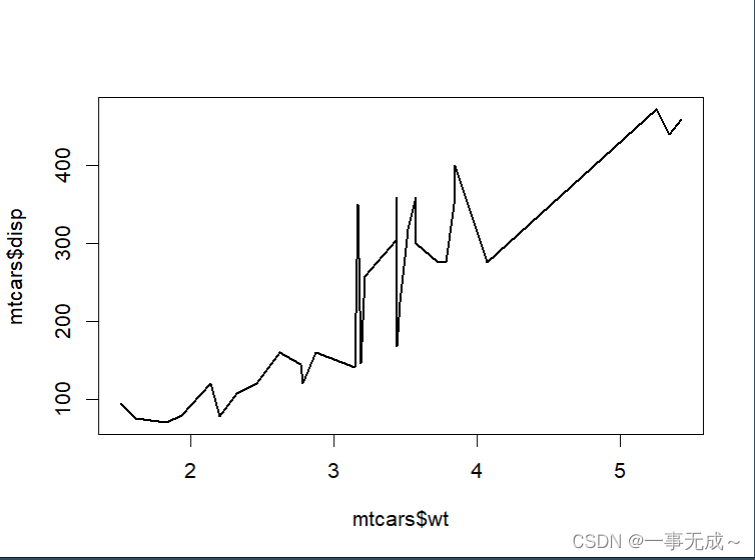
plot(mtcars$wt,mtcars$disp,type='l')
plot(mtcars$wt,mtcars$disp,type='b')
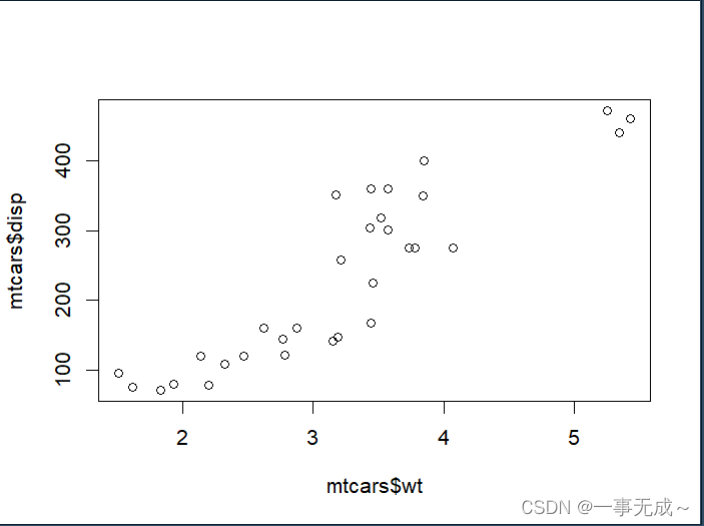
plot(mtcars$wt,mtcars$disp,type='p')
plot(mtcars$wt,mtcars$disp,type='o')
plot(mtcars$wt,mtcars$disp,type='h')
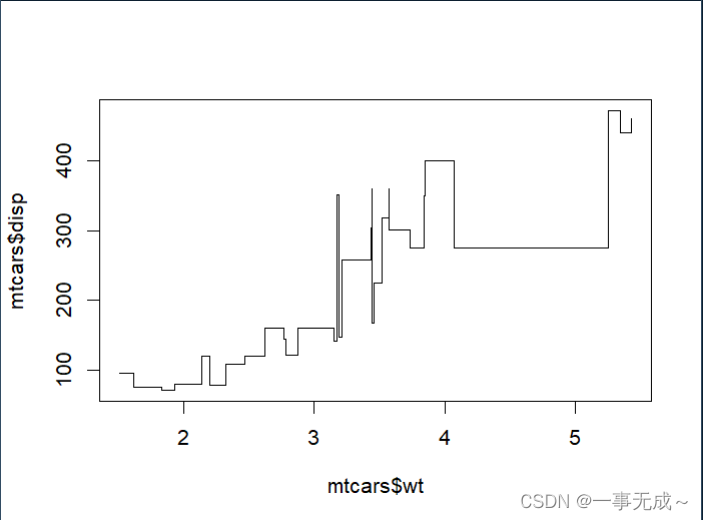
plot(mtcars$wt,mtcars$disp,type='s')
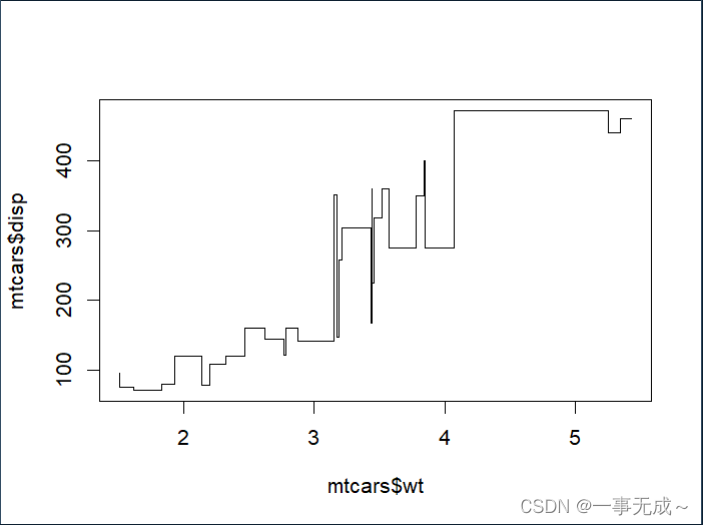
plot(mtcars$wt,mtcars$disp,type='S')
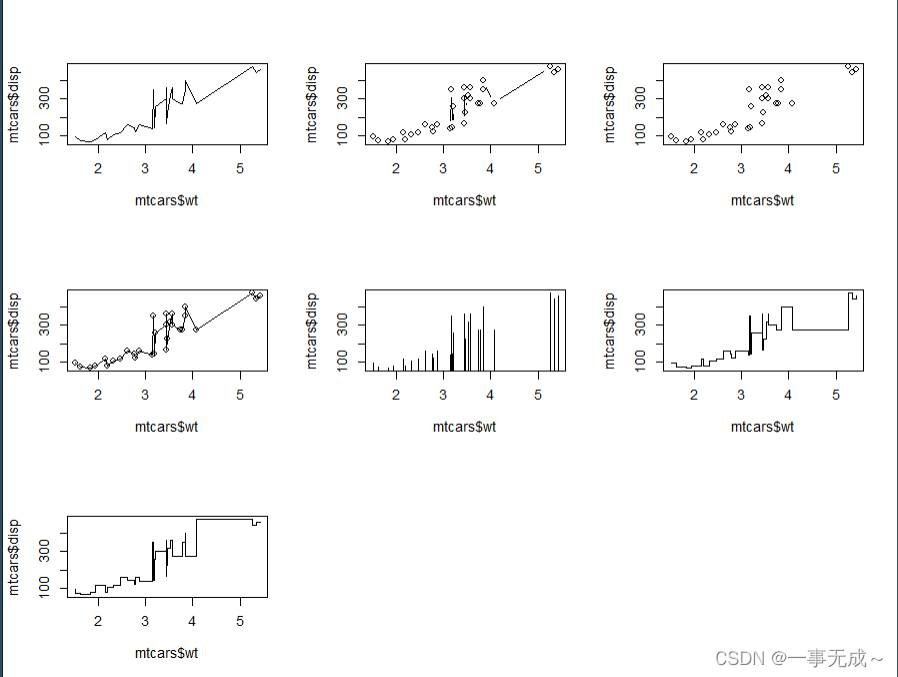
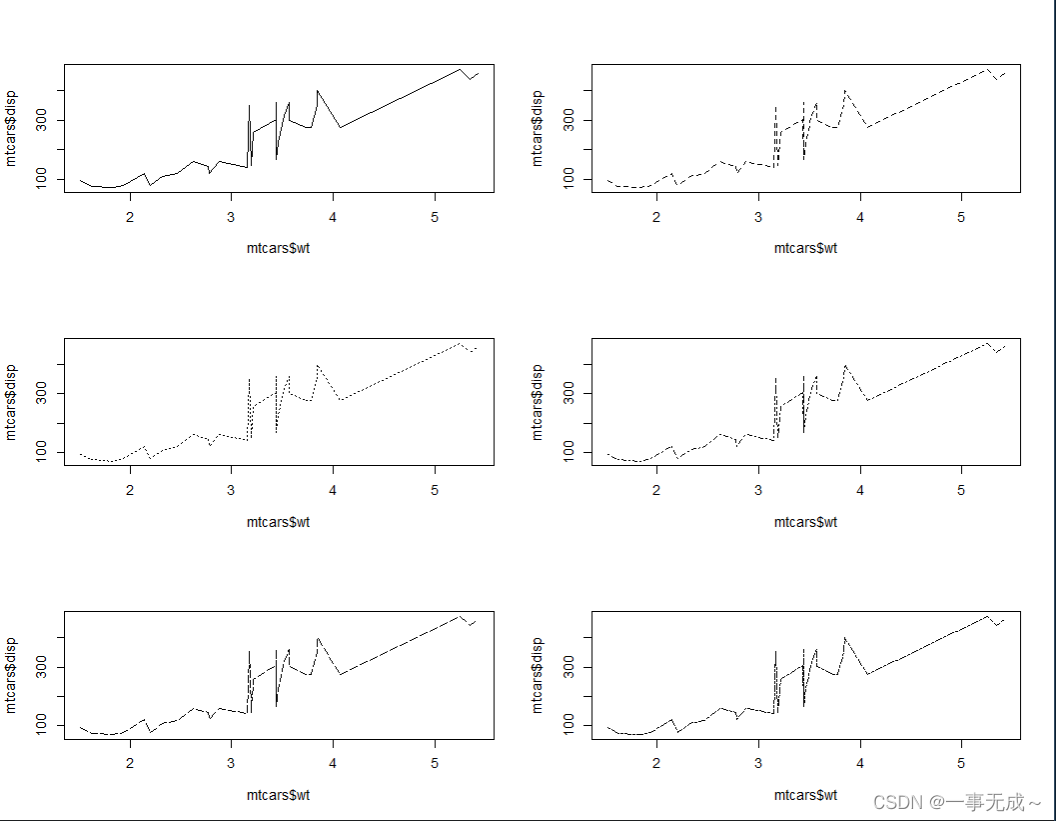
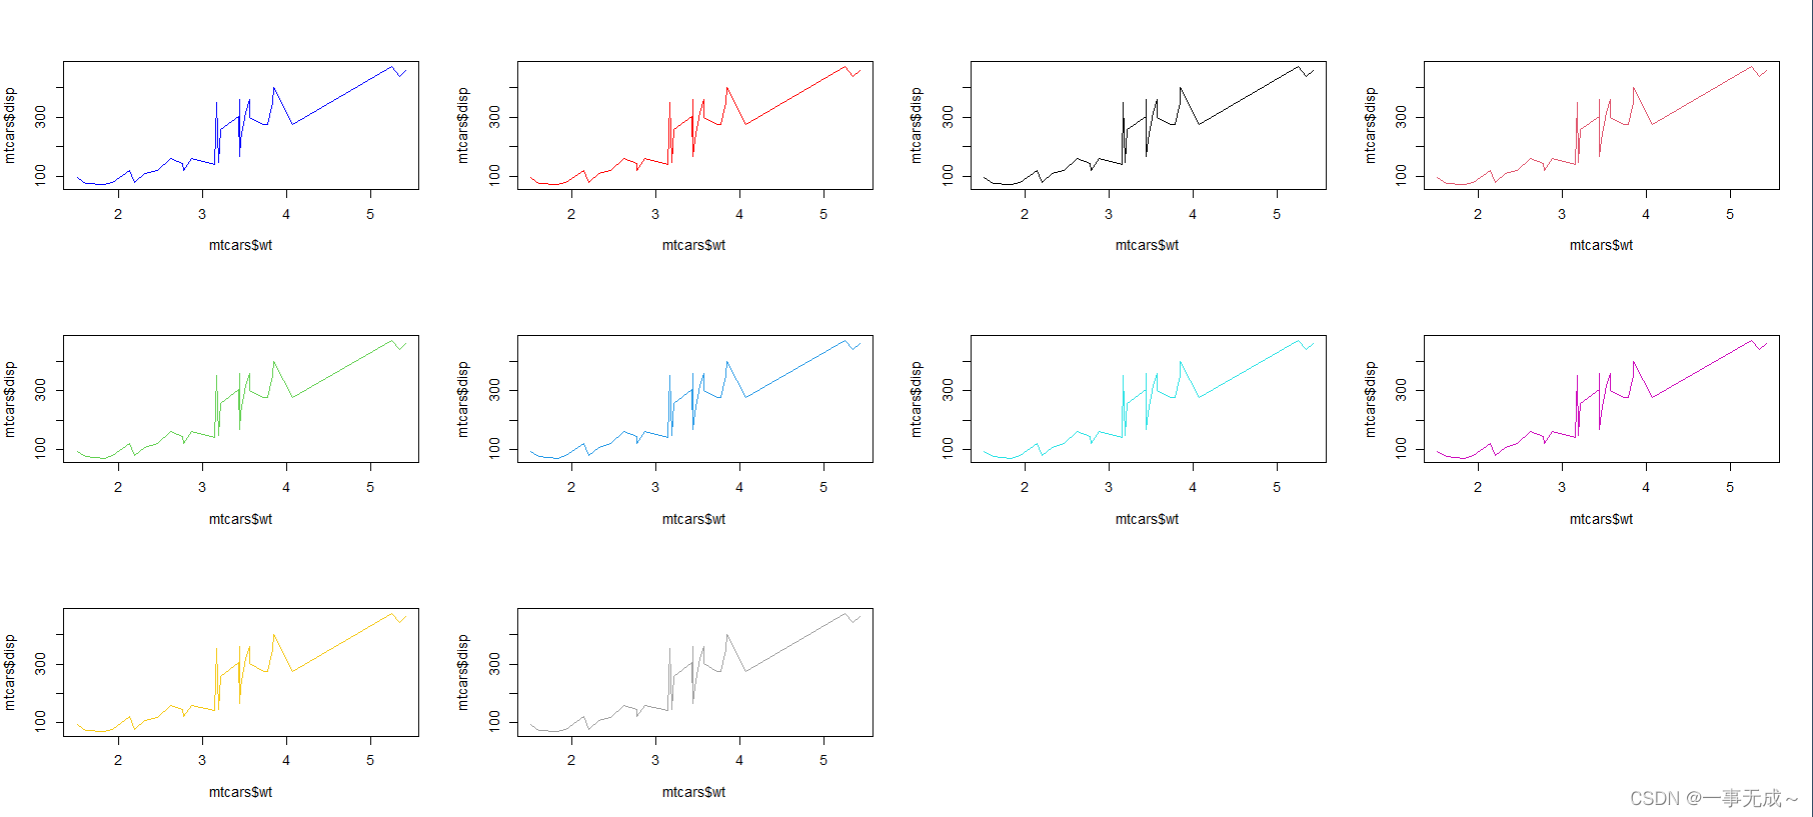
一页多图画法
par(mfrow=c(3,3))#三行三列
mtcars<-mtcars[order(mtcars$wt),]
plot(mtcars$wt,mtcars$disp,type='l')
plot(mtcars$wt,mtcars$disp,type='b')
plot(mtcars$wt,mtcars$disp,type='p')
plot(mtcars$wt,mtcars$disp,type='o')
plot(mtcars$wt,mtcars$disp,type='h')
plot(mtcars$wt,mtcars$disp,type='s')
plot(mtcars$wt,mtcars$disp,type='S')


pch点符号类型
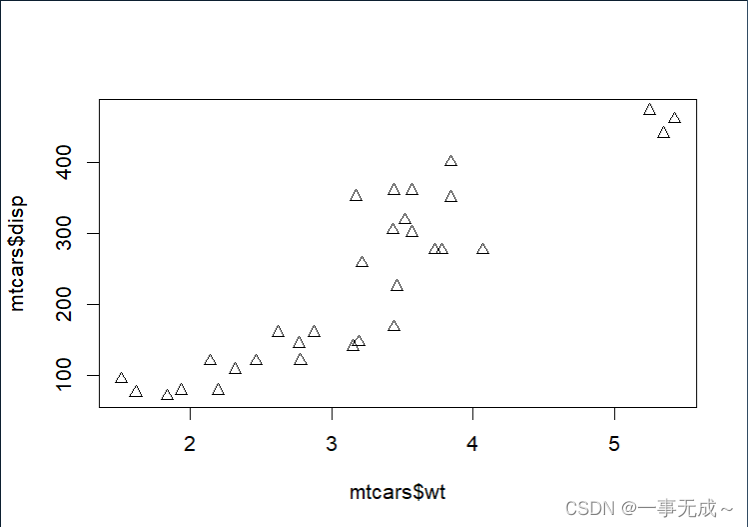
plot(mtcars$wt,mtcars$disp,pch=2)
plot(mtcars$wt,mtcars$disp,pch=1)
其余自己测试
cex控制点的大小
plot(mtcars$wt,mtcars$disp,pch=1,cex=1.5)
#默认是1, 1.5就是默认大小的1.5倍
lty线条类型
par(mfrow=c(3,2))
plot(mtcars$wt,mtcars$disp,type='l',lty=1)
plot(mtcars$wt,mtcars$disp,type='l',lty=2)
plot(mtcars$wt,mtcars$disp,type='l',lty=3)
plot(mtcars$wt,mtcars$disp,type='l',lty=4)
plot(mtcars$wt,mtcars$disp,type='l',lty=5)
plot(mtcars$wt,mtcars$disp,type='l',lty=6)
lwd线条宽度
plot(mtcars$wt,mtcars$disp,type='l',lty=1,lwd=0.5)
plot(mtcars$wt,mtcars$disp,type='l',lty=1,lwd=2)
col颜色
par(mfrow=c(3,4))
plot(mtcars$wt,mtcars$disp,type='l',lty=1,col='blue')
plot(mtcars$wt,mtcars$disp,type='l',lty=1,col='red')
plot(mtcars$wt,mtcars$disp,type='l',lty=1,col=1)
plot(mtcars$wt,mtcars$disp,type='l',lty=1,col=2)
plot(mtcars$wt,mtcars$disp,type='l',lty=1,col=3)
plot(mtcars$wt,mtcars$disp,type='l',lty=1,col=4)
plot(mtcars$wt,mtcars$disp,type='l',lty=1,col=5)
plot(mtcars$wt,mtcars$disp,type='l',lty=1,col=6)
plot(mtcars$wt,mtcars$disp,type='l',lty=1,col=7)
plot(mtcars$wt,mtcars$disp,type='l',lty=1,col=8)#直接使用颜色名字或者数字1-8
#或者使用十六进制颜色或rgb函数

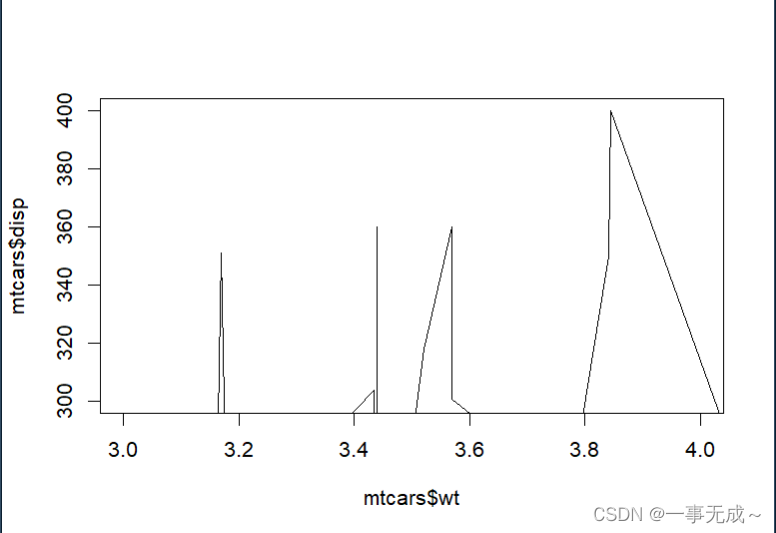
xlim ylim 坐标轴取值范围
plot(mtcars$wt,mtcars$disp,type='l',xlim=c(3,4),ylim=c(300,400))
main sub 主副标题
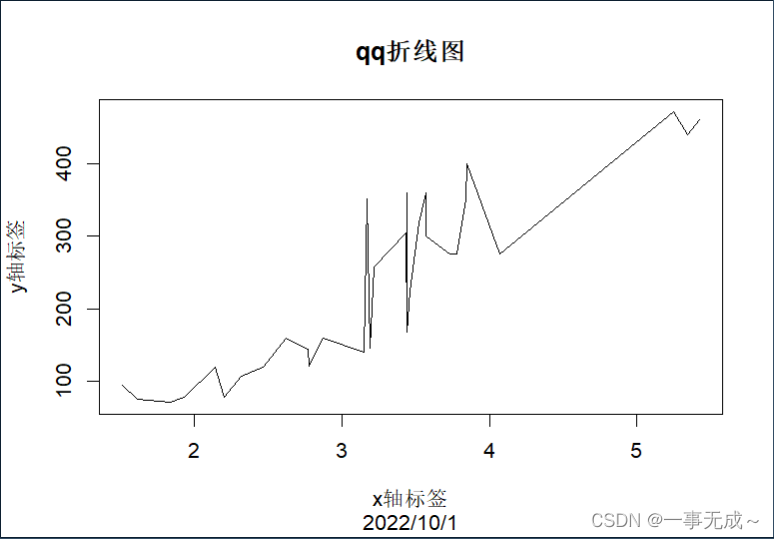
plot(mtcars$wt,mtcars$disp,type='l',lty=1,main='qq折线图',sub='2022/10/1')
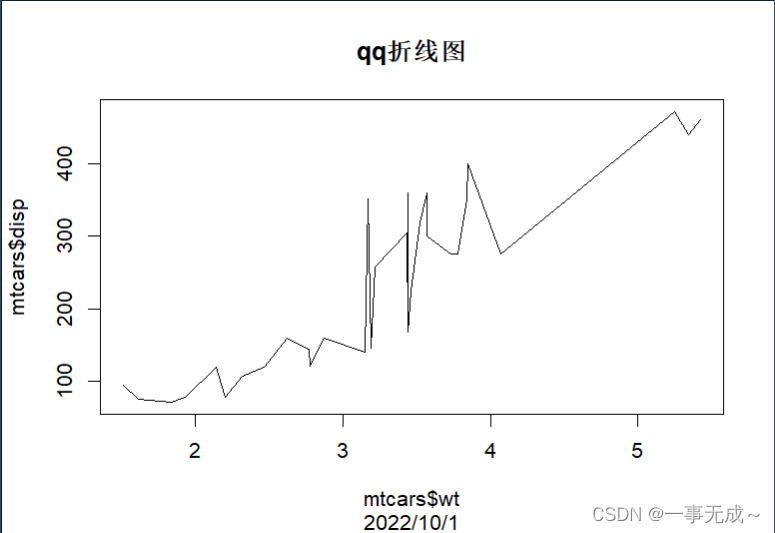
xlab,ylab 标签
plot(mtcars$wt,mtcars$disp,type='l',lty=1,main='qq折线图',sub='2022/10/1',xlab='x轴标签',ylab='y轴标签')


 被折叠的 条评论
为什么被折叠?
被折叠的 条评论
为什么被折叠?
 到【灌水乐园】发言


