


1. 多变量等值面图(Contour Plot with Multiple Variables)
这种图通常用来展示多个变量的交互作用,适合气象学中的高阶分析。
import matplotlib
matplotlib.use('TkAgg')  # 或者 'Agg','TkAgg' 适合GUI环境
import numpy as np
import matplotlib.pyplot as plt

# 创建网格数据
x = np.linspace(-10, 10, 200)
y = np.linspace(-10, 10, 200)
X, Y = np.meshgrid(x, y)

# 多个变量
Z1 = np.sin(np.sqrt(X**2 + Y**2))  # 变量1
Z2 = np.cos(np.sqrt(X**2 + Y**2))  # 变量2

# 绘制图形
fig, ax = plt.subplots(figsize=(12, 10))
cp1 = ax.contour(X, Y, Z1, cmap='coolwarm', levels=10, linewidths=2)  # 等值线1
cp2 = ax.contour(X, Y, Z2, cmap='viridis', levels=10, linewidths=2)  # 等值线2

# 添加色条
fig.colorbar(cp1, ax=ax, orientation='vertical', label='Variable 1')
fig.colorbar(cp2, ax=ax, orientation='vertical', label='Variable 2')

# 注释和标题
ax.set_title('Multi-variable Contour Plot', fontsize=18)
ax.set_xlabel('X axis', fontsize=14)
ax.set_ylabel('Y axis', fontsize=14)

plt.show()
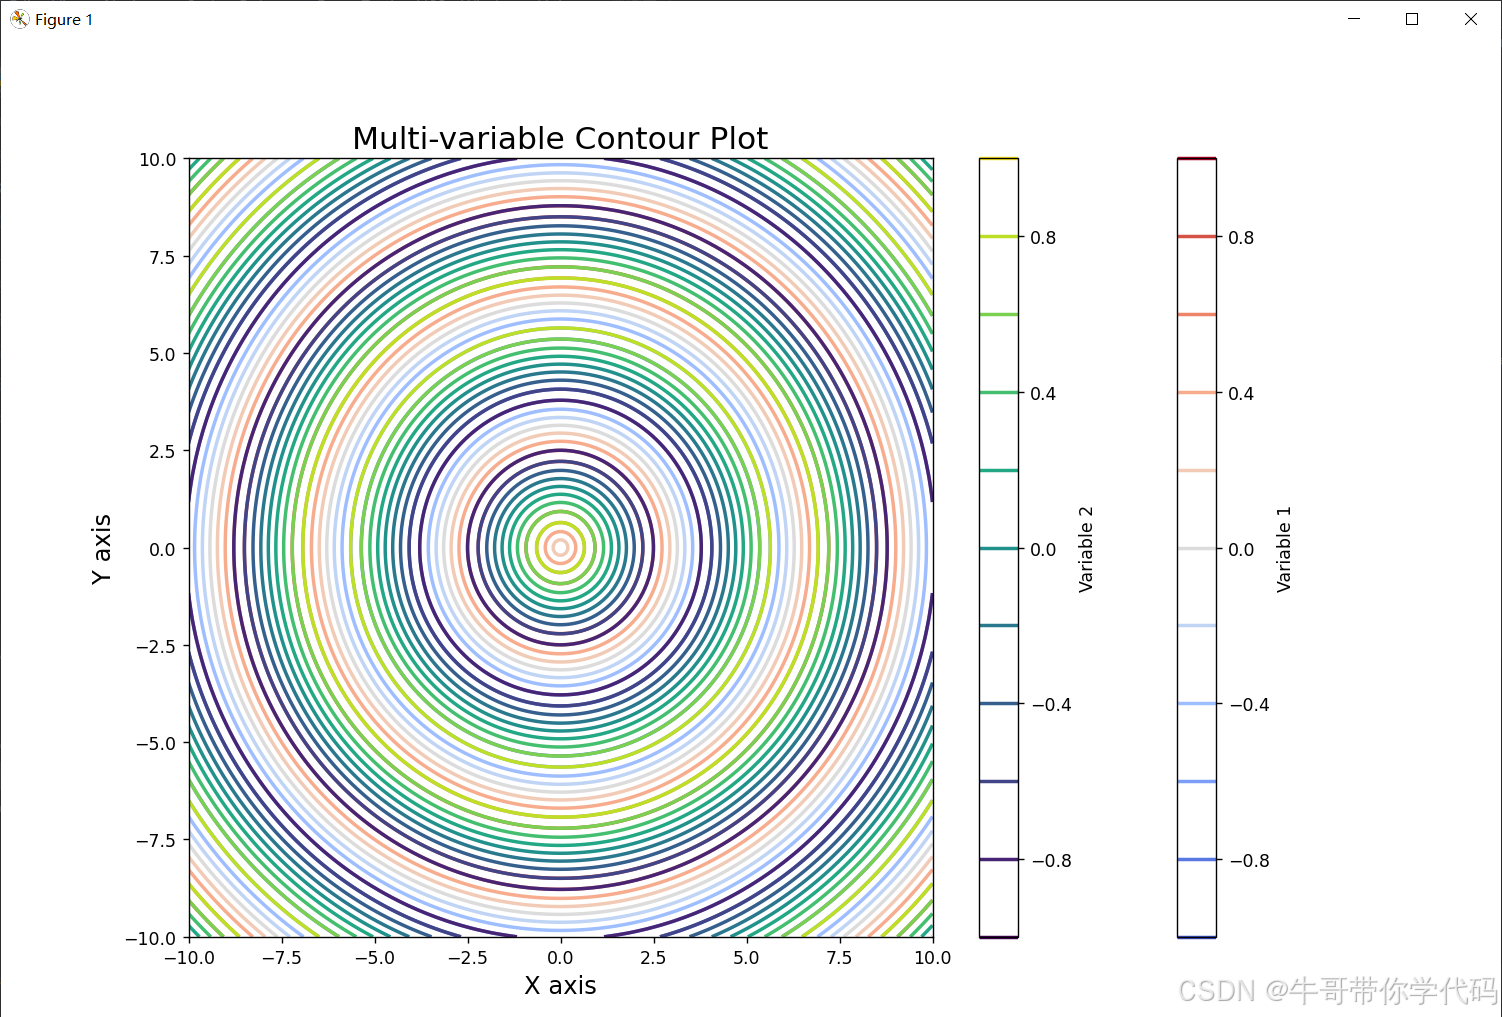
特性:
- 同时展示两个变量,使用不同的颜色映射来区分。
- 适合展示复杂的气象变量,如温度、湿度、风速等之间的关系。
2.全球气候模型(Global Climate Model)预测结果图(GCM Predictions)
使用气候模型预测数据,展示不同情景下的温度变化、降水量、海平面变化等。通常使用地球表面的颜色映射来展示大范围的变化。
import matplotlib
matplotlib.use('TkAgg')  # 或者 'Agg','TkAgg' 适合GUI环境
import numpy as np
import matplotlib.pyplot as plt
import cartopy.crs as ccrs
from cartopy import feature

# 创建网格数据
lon = np.linspace(-180, 180, 360)
lat = np.linspace(-90, 90, 180)
lon, lat = np.meshgrid(lon, lat)

# 假设的气候模型预测数据
temperature = 30 + 10 * np.sin(np.radians(lat))  # 温度场

# 创建图形
fig = plt.figure(figsize=(15, 12))
ax = fig.add_subplot(111, projection=ccrs.PlateCarree())

# 绘制气温数据
ax.contourf(lon, lat, temperature, 60, cmap='coolwarm', transform=ccrs.PlateCarree())

# 添加地图元素
ax.coastlines()
ax.add_feature(feature.BORDERS, linestyle=':', edgecolor='gray')

# 添加色条
plt.colorbar(ax.contourf(lon, lat, temperature, 60, cmap='coolwarm'), ax=ax, orientation='vertical', label='Temperature (°C)')

# 标题和标签
ax.set_title('Global Climate Model Prediction: Temperature', fontsize=18)

plt.show()
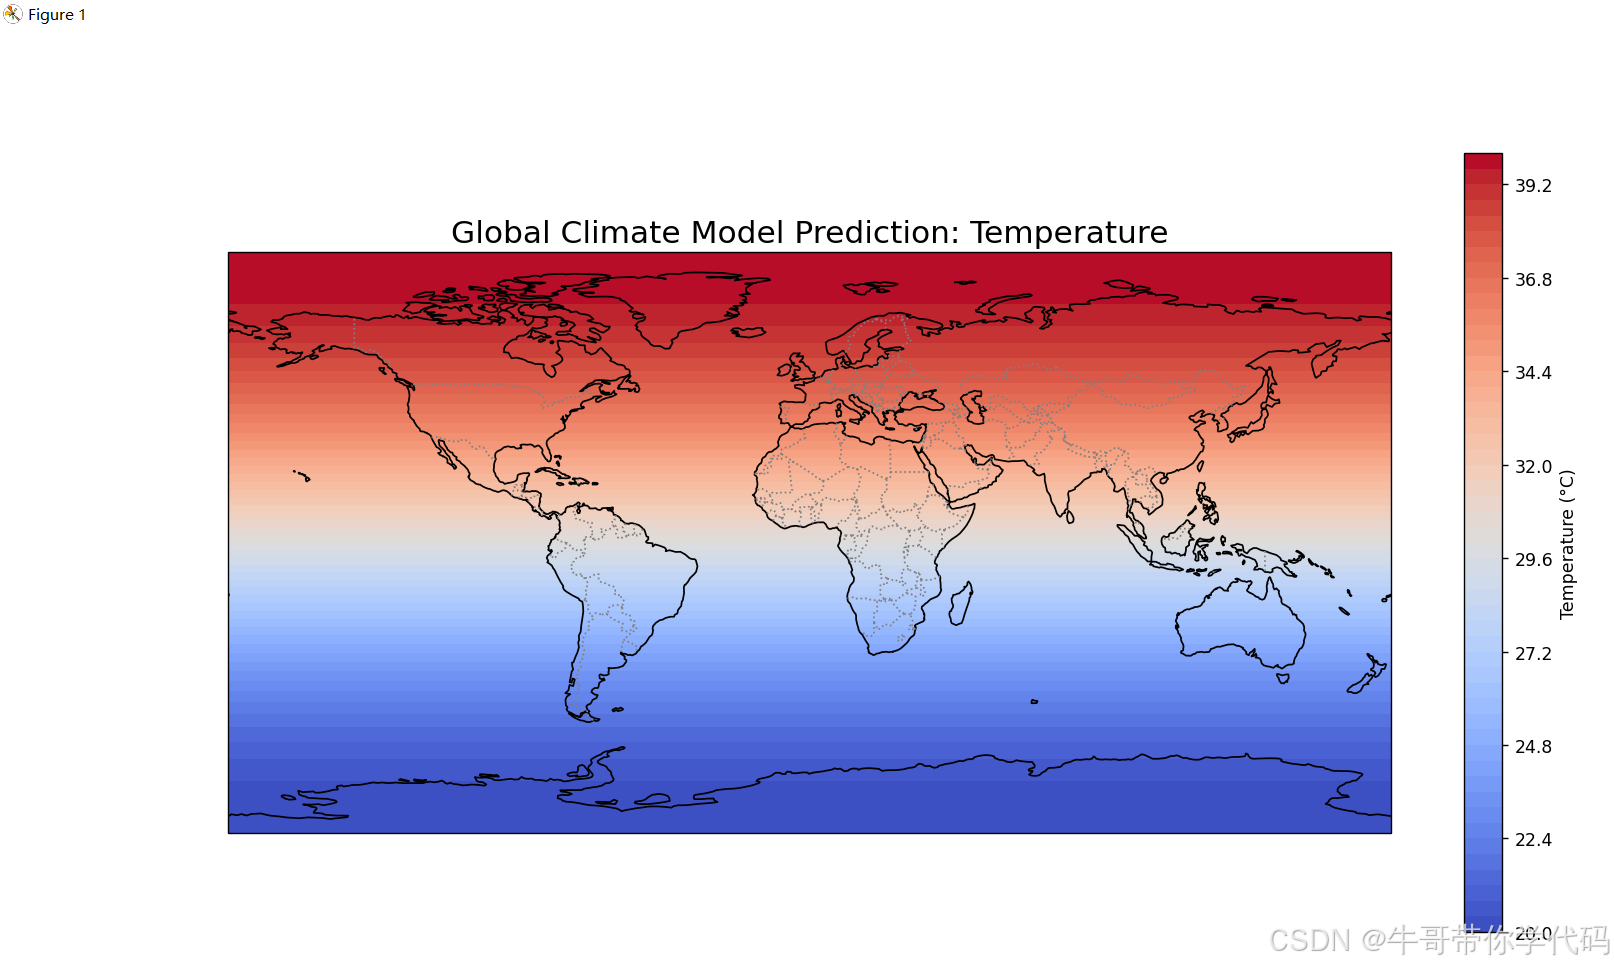
特性:
- 通过地理坐标系展示全球气候变化的结果,适合全球气候模型(GCM)的结果展示。
- 使用Cartopy库来处理地理数据,结合颜色映射展示气象变量在全球尺度上的分布。
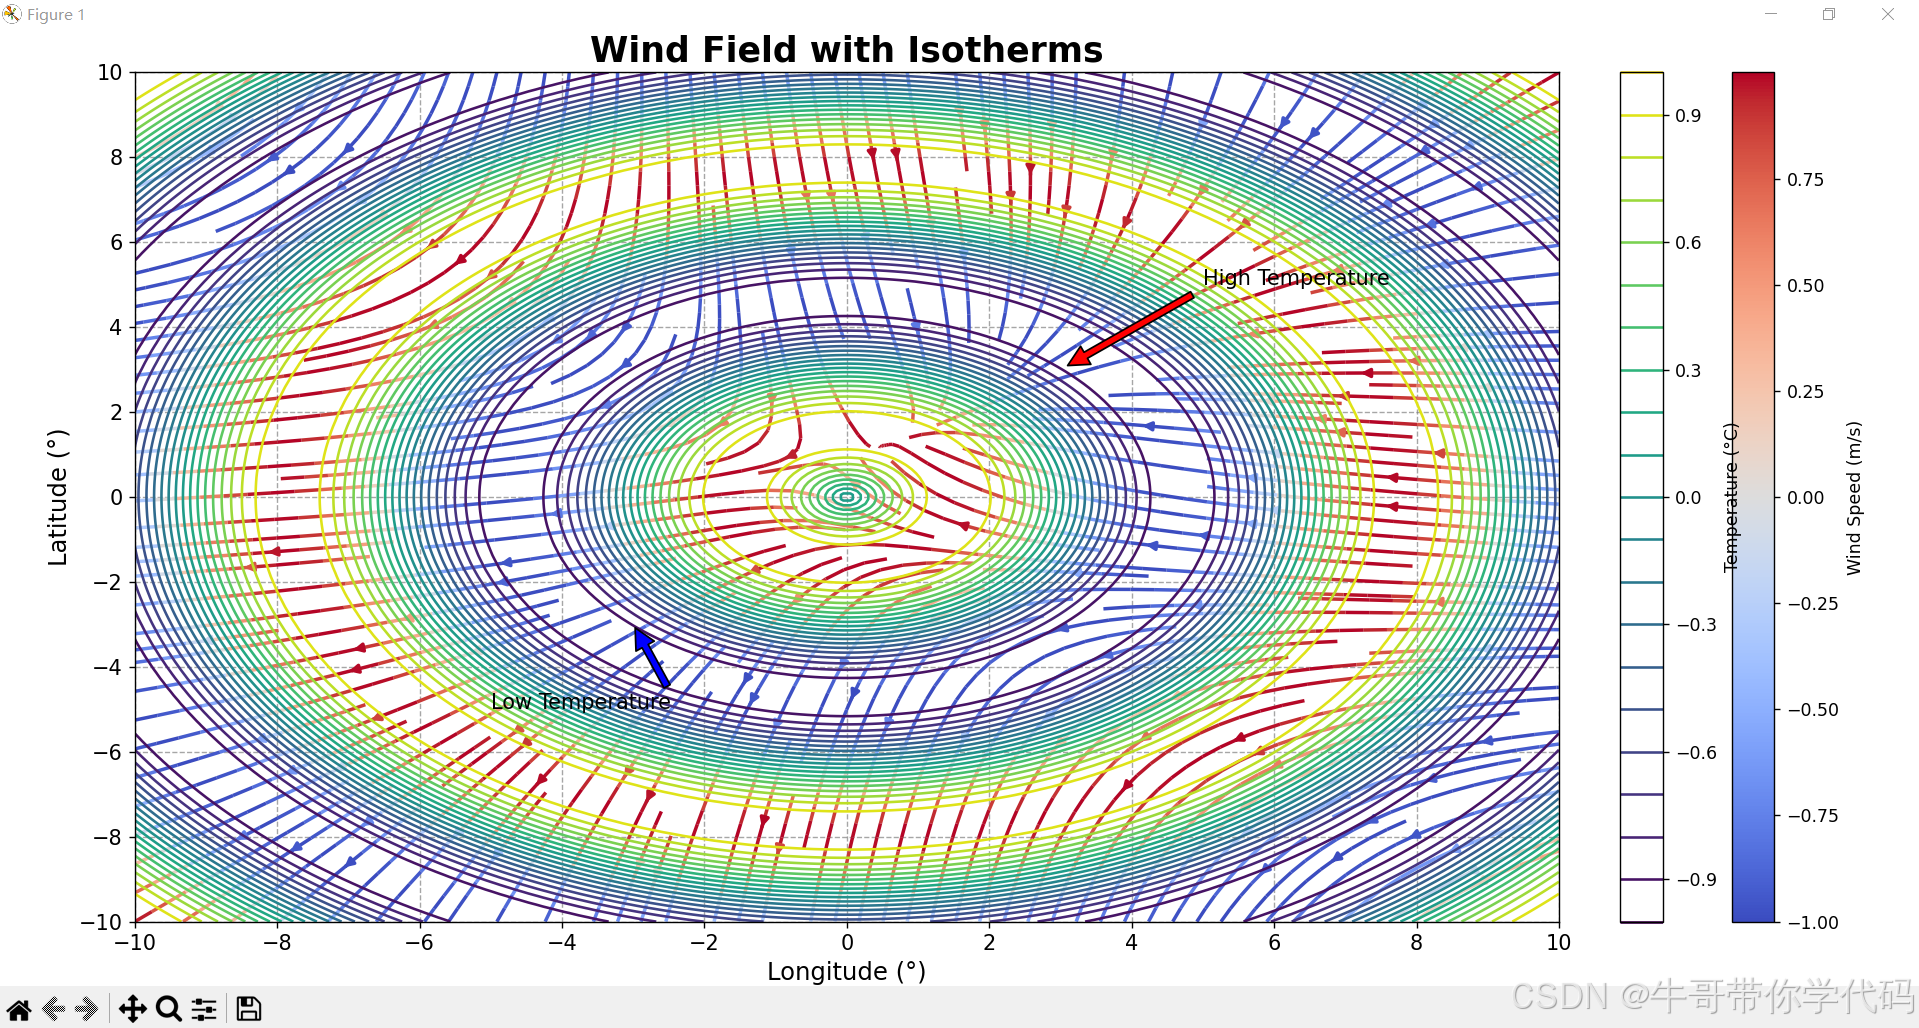
3. 风场流线与等温线叠加(Streamline with Isotherms)
import matplotlib
matplotlib.use('TkAgg')  # 或者 'Agg','TkAgg' 适合GUI环境
import numpy as np
import matplotlib.pyplot as plt
import cartopy.crs as ccrs
from cartopy import feature
import numpy as np
import matplotlib.pyplot as plt
import matplotlib.colors as mcolors
from matplotlib import cm

# 创建网格数据
x = np.linspace(-10, 10, 200)
y = np.linspace(-10, 10, 200)
X, Y = np.meshgrid(x, y)

# 风场数据
U = -1 - X**2 + Y  # U分量
V = 1 + X - Y**2   # V分量

# 温度场(假设的气象数据)
T = np.sin(np.sqrt(X**2 + Y**2))

# 创建图形
fig, ax = plt.subplots(figsize=(12, 10))

# 绘制流线图(风场)
strm = ax.streamplot(X, Y, U, V, color=T, linewidth=2, cmap='coolwarm', density=2)

# 绘制等温线
contour = ax.contour(X, Y, T, levels=20, cmap='viridis', linewidths=1.5)

# 添加色条(流线图对应的温度)
fig.colorbar(strm.lines, ax=ax, label='Wind Speed (m/s)', orientation='vertical', fraction=0.03, pad=0.04)

# 添加等温线色条
contour_cb = plt.colorbar(contour, ax=ax, orientation='vertical', label='Temperature (°C)', fraction=0.03, pad=0.04)

# 设置标题和轴标签
ax.set_title('Wind Field with Isotherms', fontsize=20, weight='bold')
ax.set_xlabel('Longitude (°)', fontsize=14)
ax.set_ylabel('Latitude (°)', fontsize=14)

# 设置图例和注释
ax.annotate('High Temperature', xy=(3, 3), xytext=(5, 5),
            arrowprops=dict(facecolor='red', shrink=0.05),
            fontsize=12, color='black')

ax.annotate('Low Temperature', xy=(-3, -3), xytext=(-5, -5),
            arrowprops=dict(facecolor='blue', shrink=0.05),
            fontsize=12, color='black')

# 网格和坐标轴格式
ax.grid(True, linestyle='--', color='gray', alpha=0.7)
ax.set_xticks(np.arange(-10, 11, 2))
ax.set_yticks(np.arange(-10, 11, 2))
ax.tick_params(axis='both', labelsize=12)

# 添加水印(如果需要标识数据来源)
# ax.text(0.5, 0.5, 'Data Source: XYZ', color='gray', fontsize=16, ha='center', va='center', alpha=0.5)

plt.tight_layout()
plt.show()


 810
810

 被折叠的 条评论
为什么被折叠?
被折叠的 条评论
为什么被折叠?
 到【灌水乐园】发言


