1、实现效果图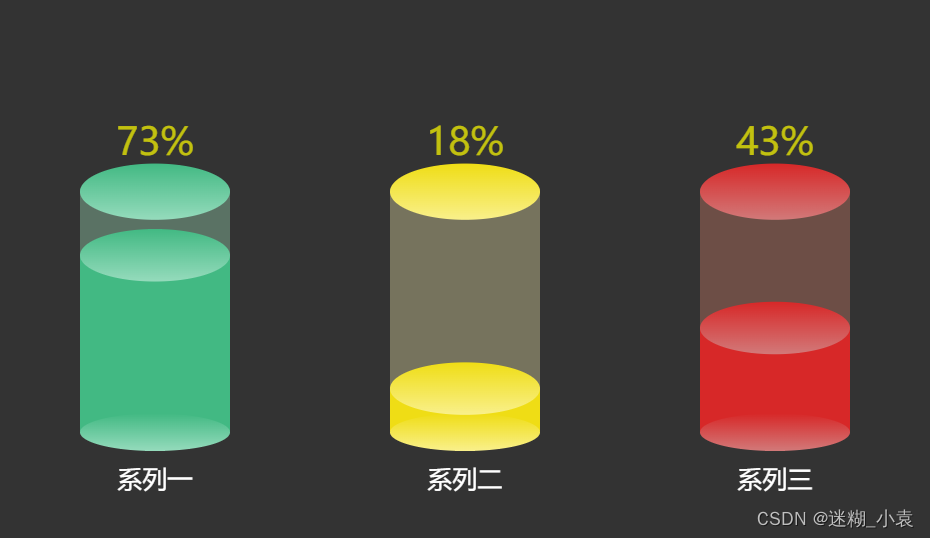
2、代码
var dataList = [
  { name: '系列一', value: 73, max: 100, headColor1: 'rgba(66,185,131,1)', headColor2: 'rgba(149,219,188,1)', upBarColor: 'rgba(162,230,192,0.5)',bottomBarColor: 'rgba(66,185,131,1)' },
  { name: '系列二', value: 18, max: 100, headColor1: 'rgba(239,221,21,1)', headColor2: 'rgba(249,240,139,1)', upBarColor: 'rgba(242,232,171,0.5)',bottomBarColor: 'rgba(239,221,21,1)' },
  { name: '系列三', value: 43, max: 100, headColor1: 'rgba(215,40,40,1)', headColor2: 'rgba(210,121,121,1)', upBarColor: 'rgba(215,128,106,0.5)' ,bottomBarColor: 'rgba(215,40,40,1)'}
];
let colorList = ['green', 'yellow', 'red']
// 头部数据
let topData = dataList.map((item) => {
  return {
    name: '', value: item.max,
    symbolPosition: 'end',
    itemStyle: {
      normal: {
        color: new echarts.graphic.LinearGradient(
          0,
          0,
          0,
          1,
          [
            {
              offset: 0,
              color: item.headColor1
            },
            {
              offset: 1,
              color: item.headColor2
            }
          ],
          false
        )
      }
    }
  };
});
// 底部立体柱子
let bottomBar = dataList.map((item) => {
  return {
    value: item.value,
    itemStyle: {
      normal: {
        color: item.bottomBarColor
      }
    }
  };
});

// 底下圆片
let bottomCircle = dataList.map((item) => {
  return {
    name: '',
    value: item.max,
    itemStyle: {
      normal: {
        color: new echarts.graphic.LinearGradient(
          0,
          0,
          0,
          1,
          [
            {
              offset: 0,
              color: item.headColor1
            },
            {
              offset: 1,
              color: item.headColor2
            }
          ],
          false
        )
      }
    }
  };
});
// 中间圆片
let middleCircle = dataList.map((item) => {
  return {
    name: '',
    value: item.value,
    symbolPosition: 'end',
    itemStyle: {
      normal: {
        color: new echarts.graphic.LinearGradient(
          0,
          0,
          0,
          1,
          [
            {
              offset: 0,
              color: item.headColor1
            },
            {
              offset: 1,
              color: item.headColor2
            }
          ],
          false
        )
      }
    }
  };
});
// 上边的柱子
let upBar = dataList.map((item) => {
  return {
    name: item.name,
    value: item.max - item.value,
    itemStyle: {
      normal: {
        color: item.upBarColor
      }
    }
  };
});

option = {
  backgroundColor: '#333333',
  tooltip: {
    trigger: 'item',
    backgroundColor: 'rgba(0,0,0,0.5)',
    borderColor: 'rgba(89,211,255,1)',
    borderWidth: 2,
    padding: 5,
    textStyle: {
      color: 'rgba(89,211,255,1)',
      fontSize: 18,
      width: 300,
      height: 40
    },
    formatter: '{c}' + '%',
    extraCssText: 'box-shadow: 0 0 3px rgba(0, 0, 0, 0.3);'
    // 自定义的 CSS 样式
  },
  grid: {
    bottom: '20%',
    top: '35%',
    right: '0%',
    left: '0%'
  },
  xAxis: {
    data: ['系列一', '系列二', '系列三'],
    axisTick: {
      show: false
    },
    axisLine: {
      show: false
    },
    axisLabel: {
      show: true,
      textStyle: {
        color: '#fff',
        fontSize:20
      },
      margin: 30 //刻度标签与轴线之间的距离。
    }
  },
  yAxis: {
    splitLine: {
      show: false
    },
    axisTick: {
      show: false
    },
    axisLine: {
      show: false
    },
    axisLabel: {
      show: false
    }
  },
  series: [
    // 头
    {
      name: '',
      type: 'pictorialBar',
      symbolSize: [120, 45],
      symbolOffset: [0, -20],
      z: 12,
      // itemStyle: {
      //   normal: {
      //     color: new echarts.graphic.LinearGradient(
      //       0,
      //       0,
      //       0,
      //       1,
      //       [
      //         {
      //           offset: 0,
      //           color: 'red'
      //         },
      //         {
      //           offset: 1,
      //           color: 'red'
      //         }
      //       ],
      //       false
      //     )
      //   }
      // },
      data: topData
    },
    //底部立体柱
    {
      stack: '1',
      type: 'bar',
      silent: true,
      barWidth: 120,
      data: bottomBar,
      itemStyle: {
        normal: {
          color: {
            x: 0,
            y: 0,
            x2: 0,
            y2: 1,
            type: 'linear',
            global: false,
            colorStops: [
              {
                //第一节下面
                offset: 0,
                color: 'rgba(0,255,245,0.5)'
              },
              {
                offset: 1,
                color: '#43bafe'
              }
            ]
          }
        }
      }
    },
    //最底下的圆片
    {
      name: '',
      type: 'pictorialBar',
      symbolSize: [120, 30],
      symbolOffset: [0, 16],
      z: 12,
      itemStyle: {
        normal: {
          color: new echarts.graphic.LinearGradient(0, 0, 0, 1, [
            {
              offset: 0,
              color: 'rgba(89,211,255,1)'
            },
            {
              offset: 1,
              color: 'rgba(23,237,194,1)'
            }
          ])
        }
      },
      data: bottomCircle
    },
    // 中间圆片
    {
      name: '',
      type: 'pictorialBar',
      symbolSize: [120, 42],
      symbolOffset: [0, -20],
      itemStyle: {
        normal: {
          color: new echarts.graphic.LinearGradient(
            0,
            0,
            0,
            1,
            [
              {
                offset: 0,
                color: 'rgba(89,211,255,1)'
              },
              {
                offset: 1,
                color: 'rgba(23,237,194,1)'
              }
            ],
            false
          )
        }
      },
      z: 12,
      data: middleCircle
    },
    //上部立体柱
    {
      //上部立体柱
      stack: '1',
      type: 'bar',
      itemStyle: {
        normal: {
          color: '#3E8BE6',
          opacity: 0.7
        }
      },
      label: {
        show: true,
        position: 'top', //top / left / right / bottom / inside / insideLeft / insideRight / insideTop / insideBottom / insideTopLeft / insideBottomLeft / insideTopRight / insideBottomRight
        distance: 20,
        color: '#FFFE00',
        fontSize: 30,
        formatter: function (item) {
          var a = 100;
          return a - item.value + '%';
        }
      },
      silent: true,
      barWidth: 120,
      //barGap: '-100%', // Make series be overlap
      data: upBar
    }
  ]
};


 465
465


 被折叠的 条评论
为什么被折叠?
被折叠的 条评论
为什么被折叠?
 到【灌水乐园】发言


