


模型目的
通过“港口岸电用电次数”、“港口岸电用电量”、“港口污染物接收数量”、“港口污染物处理数量”四个指标来评估20家港口企业在绿色发展方面的表现,并作出评级。之后根据四个特征指标和最终评级作决策树可视化。
评级规则:待整改(0-20)、一般(20-40)、良好(40-60)、优秀(60-80)、绿色楷模(80-100)
数据准备
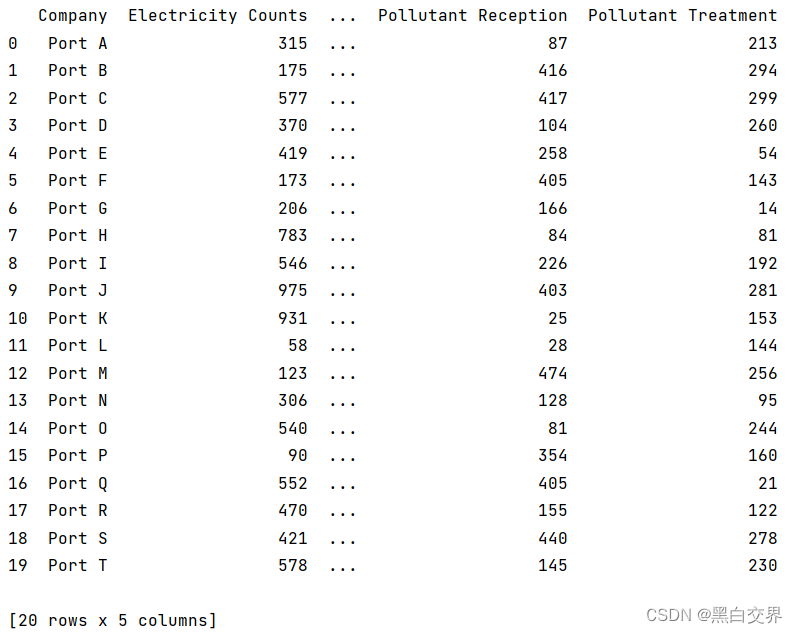
假设20家港口企业的名称分别为“Port A”到“Port T”,四个指标的数据随机生成,则数据生成如下:
# 港口企业名称
companies = ['Port A', 'Port B', 'Port C', 'Port D', 'Port E', 'Port F', 'Port G', 'Port H', 'Port I', 'Port J',
             'Port K', 'Port L', 'Port M', 'Port N', 'Port O', 'Port P', 'Port Q', 'Port R', 'Port S', 'Port T']

# 随机生成各项指标数据
np.random.seed(10)  # 设置随机种子以确保结果可复现
electricity_counts = np.random.randint(50, 1000, size=20)
electricity_consumption = np.random.randint(1000, 10000, size=20)
pollutant_reception = np.random.randint(10, 500, size=20)
pollutant_treatment = np.random.randint(10, 300, size=20)

# 创建数据框存储数据
data = pd.DataFrame({'Company': companies,
                     'Electricity Counts': electricity_counts,
                     'Electricity Consumption': electricity_consumption,
                     'Pollutant Reception': pollutant_reception,
                     'Pollutant Treatment': pollutant_treatment})
得到的数据如下:
得分评级
得到了四个指标的数据之后,我们对企业进行打分,得到Score一列。之后由于Score一列的数据范围较广,我们使用MinMaxScaler方法将其缩放到 [0, 100] 之中,之后我们用pd.cut函数作出得分评级Rating,并将评级映射为可以放入模型的编码Rating_Code。代码如下:
# 计算综合评分
data['Score'] = (0.2*data['Electricity Counts'] + 0.3*data['Electricity Consumption'] +
                 0.1*data['Pollutant Reception'] + 0.4*data['Pollutant Treatment'])/10

# 提取评分列进行缩放
scores = data[['Score']]

# 初始化MinMaxScaler,设置缩放范围为0到100
scaler = MinMaxScaler(feature_range=(0, 100))

# 对评分进行缩放
data['Scaled_Score'] = scaler.fit_transform(scores).flatten()

# 定义评级类别和标签
bins = [0, 20, 40, 60, 80, 100]
labels = ['待整改', '一般', '良好', '优秀', '绿色楷模']

# 添加评级列
data['Rating'] = pd.cut(data['Scaled_Score'], bins=bins, labels=labels, right=False)

# 使用LabelEncoder对评级进行编码
encoder = LabelEncoder()
data['Rating_Code'] = encoder.fit_transform(data['Rating'])
决策树模型构建
我们选取四个指标为特征值X,选取评级编码Rating_Code为目标值Y进行决策树的构建。如下:
# 准备数据
X = data[['Electricity Counts', 'Electricity Consumption', 'Pollutant Reception', 'Pollutant Treatment']]
y = data['Rating_Code']

# 初始化决策树分类器
clf = DecisionTreeClassifier(random_state=10)
clf.fit(X, y)
决策树可视化
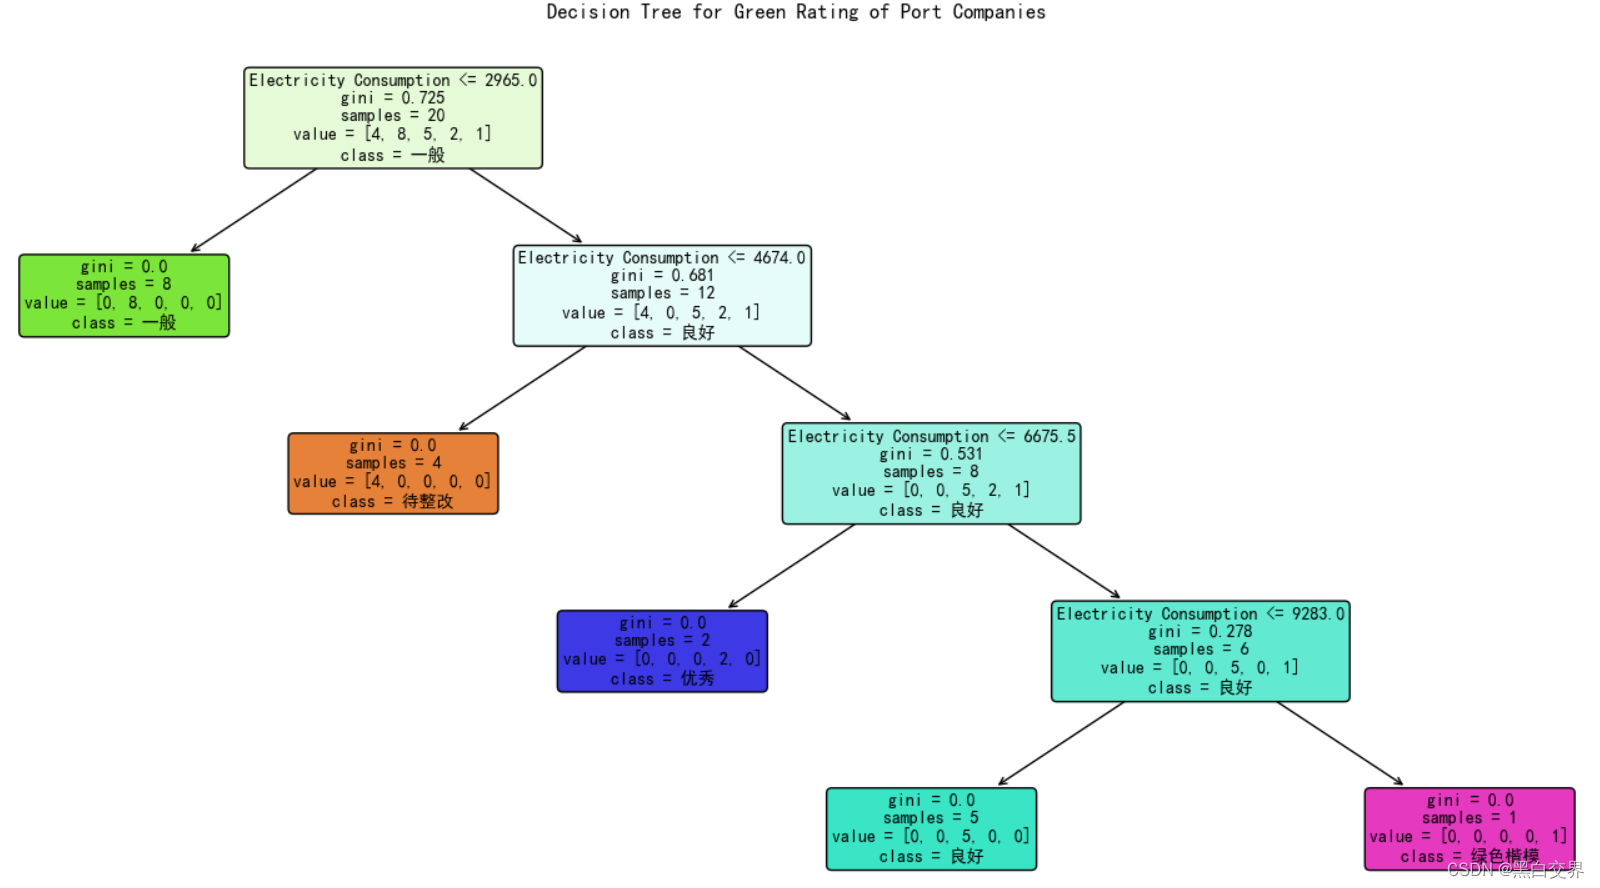
接下来使用plot_tree对决策树进行可视化操作,通过参数调整可视化的大小以适应图像展示,最后保存为图片文件。
# 可视化决策树
plt.figure(figsize=(16, 10))
plot_tree(clf, filled=True, feature_names=['Electricity Counts', 'Electricity Consumption', 'Pollutant Reception', 'Pollutant Treatment'], class_names=labels, rounded=True, fontsize=10)
plt.title("Decision Tree for Green Rating of Port Companies")
plt.tight_layout()  # 调整布局以优化间距
plt.savefig("DecisionTree_GreenRating_PortCompanies.png")
plt.show()
可视化结果如下所示:
完整代码
import pandas as pd
import numpy as np
from sklearn.tree import DecisionTreeClassifier, plot_tree
from sklearn.preprocessing import LabelEncoder, MinMaxScaler
import matplotlib.pyplot as plt


plt.rcParams['font.sans-serif'] = ['SimHei']  # 设置字体为中文支持的字体


# 港口企业名称
companies = ['Port A', 'Port B', 'Port C', 'Port D', 'Port E', 'Port F', 'Port G', 'Port H', 'Port I', 'Port J',
             'Port K', 'Port L', 'Port M', 'Port N', 'Port O', 'Port P', 'Port Q', 'Port R', 'Port S', 'Port T']

# 随机生成各项指标数据
np.random.seed(10)  # 设置随机种子以确保结果可复现
electricity_counts = np.random.randint(50, 1000, size=20)
electricity_consumption = np.random.randint(1000, 10000, size=20)
pollutant_reception = np.random.randint(10, 500, size=20)
pollutant_treatment = np.random.randint(10, 300, size=20)

# 创建数据框存储数据
data = pd.DataFrame({'Company': companies,
                     'Electricity Counts': electricity_counts,
                     'Electricity Consumption': electricity_consumption,
                     'Pollutant Reception': pollutant_reception,
                     'Pollutant Treatment': pollutant_treatment})
# print(data)

# 计算综合评分
data['Score'] = (0.2*data['Electricity Counts'] + 0.3*data['Electricity Consumption'] +
                 0.1*data['Pollutant Reception'] + 0.4*data['Pollutant Treatment'])/10

# 提取评分列进行缩放
scores = data[['Score']]

# 初始化MinMaxScaler,设置缩放范围为0到100
scaler = MinMaxScaler(feature_range=(0, 100))

# 对评分进行缩放
data['Scaled_Score'] = scaler.fit_transform(scores).flatten()

# 确保Scaled_Score在期望的范围内
# print(data)
# print(data['Scaled_Score'].min(), data['Scaled_Score'].max())

# 定义评级类别和标签
bins = [0, 20, 40, 60, 80, 100]
labels = ['待整改', '一般', '良好', '优秀', '绿色楷模']

# 添加评级列
data['Rating'] = pd.cut(data['Scaled_Score'], bins=bins, labels=labels, right=False)

# 使用LabelEncoder对评级进行编码
encoder = LabelEncoder()
data['Rating_Code'] = encoder.fit_transform(data['Rating'])
# print(data)

# 准备数据
X = data[['Electricity Counts', 'Electricity Consumption', 'Pollutant Reception', 'Pollutant Treatment']]
y = data['Rating_Code']

# 初始化决策树分类器
clf = DecisionTreeClassifier(random_state=10)
clf.fit(X, y)

# 可视化决策树
plt.figure(figsize=(16, 10))
plot_tree(clf, filled=True, feature_names=['Electricity Counts', 'Electricity Consumption', 'Pollutant Reception', 'Pollutant Treatment'], class_names=labels, rounded=True, fontsize=10)
plt.title("Decision Tree for Green Rating of Port Companies")
plt.tight_layout()  # 调整布局以优化间距
plt.savefig("DecisionTree_GreenRating_PortCompanies.png")
plt.show()
# 代码实际上存在一点瑕疵,例如作出的评级存在最大值最小值评级为NAN的情况等,如有修改建议,希望不吝赐教


 被折叠的 条评论
为什么被折叠?
被折叠的 条评论
为什么被折叠?
 到【灌水乐园】发言


