通过NewMark方法对得到的地震动进行处理得到各个时程曲线、反应谱,以及对地震动进行基线校正和高通滤波
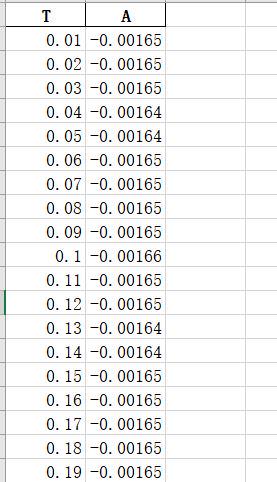
数据格式:

处理代码:
# -*- coding: utf-8 -*-
import math
import numpy as np
import pandas as pd
from scipy import signal
import matplotlib.pyplot as plt

plt.rcParams['font.sans-serif'] = ['Microsoft YaHei']
plt.rcParams['axes.unicode_minus'] = False


# ---------------------基线校正---------------------------------#
def Baseline_correction_JK(t, acceleration_g):
    # dt - ----采样时间
    # acc - ---待滤波时程记录
    # n - -----滤波阶数
    # f_low - -滤波的低频截止频率
    # f_high - 滤波的高频截止频率
    fn = 1000
    dt = 1/fn
    n = 4
    f_low = 1
    f_high = 249
    T = np.arange(dt, dt * len(t) + dt, dt)
    end = len(acceleration_g) - 1
    vel = np.cumsum(acceleration_g) * dt
    dis = np.cumsum(vel) * dt
    temp = np.cumsum(dis * (3 * T[end] * T ** 2 - 2 * T ** 3)) * dt
    a1 = 28 / 13 * (1 / (T[end] ** 2)) * (2 * vel[end] - 15 / (T[end] ** 5) * temp[end])
    a0 = vel[end] / T[end] - a1 * T[end] / 2
    acc_correction = acceleration_g - (a0 + a1 * T)
    acc_correction_t = pd.DataFrame({'T/s': t, 'Acc/g': acc_correction})
    acc_correction_t.to_excel('acc_correction.xlsx', index=False)  # 输出基线校正后的地震动数据
    # vel_correction = np.cumsum(acc_correction) * dt
    # dis_correction = np.cumsum(vel_correction) * dt
    # Response_spectrum(acc_correction, t[1]-t[0])
    # Time_history_curve(acc_correction, t, t[1]-t[0])
    Butterworth_filter_JK(dt, acc_correction, n, t, f_low, f_high)


# --------------------Butterworth滤波器因果滤波器---------------------------------#
def Butterworth_filter_JK(dt, acc, n,t ,f_low=None, f_high=None):
    # dt - ----采样时间
    # acc - ---待滤波时程记录
    # n - -----滤波阶数
    # f_low - -滤波的低频截止频率
    # f_high - 滤波的高频截止频率
    df = 1 / dt
    if f_high is None:
        # 低通滤波器
        F1 = f_low / (df / 2)
        b, a = signal.butter(n, F1, 'low')
    elif f_low is None:
        # 高通滤波器
        F2 = f_high / (df / 2)
        [b, a] = signal.butter(n, F2, 'high')
    else:
        # 带通滤波器
        F1 = f_low / (df / 2)
        F2 = f_high / (df / 2)
        b, a = signal.butter(n, [F1, F2], 'bandpass')
    acc_filter = signal.filtfilt(b, a, acc)
    # vel_filter = np.cumsum(acc_filter) * dt
    # dis_filter = np.cumsum(vel_filter) * dt
    acc_filter_t = pd.DataFrame({'T/s': t, 'Acc/g': acc_filter})
    acc_filter_t.to_excel('acc_filter.xlsx', index=False)  # 输出基线校正、滤波后的地震动数据
    # Response_spectrum(acc_filter, t[1]-t[0])
    # Time_history_curve(acc_filter, t, t[1]-t[0])


# ---------------------NewMark方法,β取1/6----------------------- #
def NewMark(acceleration_g: list, step, period):  # 地面加速度(单位:m/s^2),积分步长,结构周期
    length = len(acceleration_g)
    displacement = [0] * length  # 定义一个位移向量
    velocity = [0] * length  # 定义一个速度向量
    acceleration = [0] * length  # 定义一个加速度向量
    p1_m = [0] * (length + 1)
    a1_m = 6 / (step ** 2) + 3 / step * 0.2 * math.pi / period  # 系数a1与质量m的比值
    a2_m = 6 / step + 2 * 0.2 * math.pi / period  # 系数a2与质量m的比值
    a3_m = 2 + step / 2 * 0.2 * math.pi / period  # 系数a3与质量m的比值
    k1_m = 4 * math.pi ** 2 / period ** 2 + a1_m  # k1与质量m的比值
    for i in range(1, length - 1):
        p1_m[i] = -acceleration_g[i] + a1_m * displacement[i - 1] + a2_m * velocity[i - 1] + a3_m * acceleration[i - 1]
        displacement[i] = p1_m[i] / k1_m  # 求解位移
        velocity[i] = 3 / step * (displacement[i] - displacement[i - 1]) - 2 * velocity[i - 1] - step / 2 * \
                      acceleration[i - 1]  # 求解速度
        acceleration[i] = 6 / step ** 2 * (displacement[i] - displacement[i - 1]) - 6 / step * velocity[i - 1] - 2 * \
                          acceleration[i - 1]  # 求解加速度
    return acceleration, displacement, velocity


# -----------------反应谱函数---------------- #
def Response_spectrum(acceleration_g, deta):  # 地面加速度(单位:m/s^2);积分步长
    Response_acceleration = [max(abs(acceleration_g)) / 9.8]  # 0秒时的反应谱数值
    Response_velocity = [0]
    Response_displacement = [0]
    for T in np.arange(0.05, 6.05, 0.05):
        Ra = []
        Rv = []
        Rd = []
        a, d, v = NewMark(acceleration_g, deta, T)
        for i in range(len(acceleration_g)):
            Ra.append(abs(a[i] / 9.8 + acceleration_g[i] / 9.8))
            Rv.append(abs(v[i]))
            Rd.append(abs(d[i]))
        Response_velocity.append(100 * max(Rv))
        Response_displacement.append(100 * max(Rd))
        Response_acceleration.append(max(Ra))
    # 保存加速度、速度、位移反应谱至excel表格,分别命名为Sa、Sv、Sd
    Sa = pd.DataFrame({'period(s)': np.arange(0, 6.05, 0.05), 'Sa(g)': Response_acceleration})
    Sv = pd.DataFrame({'period(s)': np.arange(0, 6.05, 0.05), 'Sv(g)': Response_velocity})
    Sd = pd.DataFrame({'period(s)': np.arange(0, 6.05, 0.05), 'Sd(g)': Response_displacement})
    Sa.to_excel("Sa.xlsx", sheet_name="Sheet1", index=False)
    Sv.to_excel("Sv.xlsx", sheet_name="Sheet1", index=False)
    Sd.to_excel("Sd.xlsx", sheet_name="Sheet1", index=False)

    # 绘制加速度反应谱
    plt.figure(1)
    plt.plot(np.arange(0, 6.05, 0.05), Response_acceleration, 'black')
    plt.xlabel('T(s)')
    plt.ylabel('Response acceleration(g)')
    plt.axis([0, 6, 0, max(Response_acceleration) + 0.05])
    ax = plt.gca()  # gca:get current axis得到当前轴
    # 设置图片的右边框和上边框为不显示
    ax.spines['right'].set_color('none')
    ax.spines['top'].set_color('none')
    plt.show()
    # 绘制速度反应谱
    plt.figure(2)
    plt.plot(np.arange(0, 6.05, 0.05), Response_velocity, 'black')
    plt.xlabel('T(s)')
    plt.ylabel('Response velocity(cm/s)')
    plt.axis([0, 6, 0, max(Response_velocity) + 5])
    ax = plt.gca()  # gca:get current axis得到当前轴
    # 设置图片的右边框和上边框为不显示
    ax.spines['right'].set_color('none')
    ax.spines['top'].set_color('none')
    plt.show()
    # 绘制位移反应谱
    plt.figure(3)
    plt.plot(np.arange(0, 6.05, 0.05), Response_displacement, 'black')
    plt.xlabel('T(s)')
    plt.ylabel('Response displacement(cm)')
    plt.axis([0, 6, 0, max(Response_displacement) + 5])
    ax = plt.gca()  # gca:get current axis得到当前轴
    # 设置图片的右边框和上边框为不显示
    ax.spines['right'].set_color('none')
    ax.spines['top'].set_color('none')
    plt.show()


# ----------------时程曲线------------------- #
def Time_history_curve(acceleration_g, t, deta):
    a, d, v = NewMark(acceleration_g, deta, 1)
    for i in range(0, len(d)):
        a[i] = a[i] / 9.8  # 单位转换为g
        d[i] = d[i] * 100  # 单位转换为cm
        v[i] = v[i] * 100  # 单位转换为cm/s
    # 保存加速度、速度、位移时程曲线至excel表格,分别命名为Time_history_A、Time_history_V、Time_history_D
    Time_history_A = pd.DataFrame({'T': t, 'Time_history_A': a})
    Time_history_D = pd.DataFrame({'T': t, 'Time_history_A': d})
    Time_history_V = pd.DataFrame({'T': t, 'Time_history_A': v})
    Time_history_A.to_excel('Time_history_A.xlsx', index=False)
    Time_history_D.to_excel('Time_history_D.xlsx', index=False)
    Time_history_V.to_excel('Time_history_V.xlsx', index=False)

    # 绘制加速度时程曲线
    plt.figure(1)
    plt.plot(t, a, 'black')
    plt.xlabel('Time(s)')
    plt.ylabel('Acceleration(g)')
    plt.axis([0, max(t), min(a) - 0.1, max(a) + 0.1])
    ax = plt.gca()  # gca:get current axis得到当前轴
    # 设置图片的右边框和上边框为不显示
    ax.spines['right'].set_color('none')
    ax.spines['top'].set_color('none')
    plt.show()
    # 绘制速度时程曲线
    plt.figure(2)
    plt.plot(t, v, 'black')
    plt.xlabel('Time(s)')
    plt.ylabel('Velocity(cm/s)')
    plt.axis([0, max(t), min(v) - 5, max(v) + 5])
    ax = plt.gca()  # gca:get current axis得到当前轴
    # 设置图片的右边框和上边框为不显示
    ax.spines['right'].set_color('none')
    ax.spines['top'].set_color('none')
    plt.show()
    # 绘制位移时程曲线
    plt.figure(3)
    plt.plot(t, d, 'black')
    plt.xlabel('Time(s)')
    plt.ylabel('Displacement(cm)')
    plt.axis([0, max(t), min(d) - 5, max(d) + 5])
    ax = plt.gca()  # gca:get current axis得到当前轴
    # 设置图片的右边框和上边框为不显示
    ax.spines['right'].set_color('none')
    ax.spines['top'].set_color('none')
    plt.show()


if __name__ == "__main__":
    data = pd.read_excel('EW.xlsx')
    '''
    数据格式
    -------------
    |  T  |  A  |
    -------------
    |  *  |  *  |
    .......
    '''
    a_g = data['A']
    deta_t = data['T'][1] - data['T'][0]
    Baseline_correction_JK(data['T'], a_g)


 4392
4392

 被折叠的 条评论
为什么被折叠?


