


效果
下载

把标红的下载下来

也可以在echarts中定制 js文件
在需要的地方引入js文件
js
// components/typeEcharts/typeEcharts.js
import * as echarts from '../ec-canvas/echarts'
function initChart(canvas, width, height, dpr) {
console.log(echarts)
const chart = echarts.init(canvas, null, {
width: width,
height: height,
devicePixelRatio: dpr
});
canvas.setChart(chart);
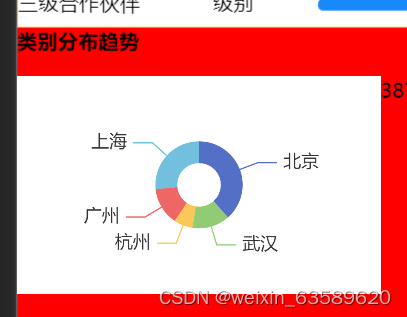
var option = {
backgroundColor: "#ffffff",
series: [{
label: {
normal: {
fontSize: 14
}
},
type: 'pie',
center: ['50%', '50%'],
radius: ['20%', '40%'],
data: [{
value: 55,
name: '北京'
}, {
value: 20,
name: '武汉'
}, {
value: 10,
name: '杭州'
}, {
value: 20,
name: '广州'
}, {
value: 38,
name: '上海'
}]
}]
};
chart.setOption(option);
return chart;
}
Page({
/**
* 页面的初始数据
*/
data: {
ec: {
onInit: initChart
},
},
})在json文件中注册
wxml
  <view class="ec-container">
     <ec-canvas style="width: 500rpx;height: 300rpx;" canvas-id="echart-pie" ec="{{ec}}" ></ec-canvas>
</view>
wxss 自己写就行


 9475
9475


 被折叠的 条评论
为什么被折叠?
被折叠的 条评论
为什么被折叠?
 到【灌水乐园】发言


