


接手了一个官网项目的开发,要求使用html原生去写,就不免有些头疼,像数据的响应式,组件化开发等这些框架带来的好处都用不了了,但是我需要使用使用组件以便于在各个页面引入开发,例如公共的导航栏,页脚等,这里给个案例可以使用html实现这种类似于组件的功能,这里不能组件互相传值,只能引入公共的样式和公共的功能
创建一个js文件
// 这里写头部引入的js文件

// 创建一个新的 script 元素
var script = document.createElement('script')
// 设置 script 元素的 src 属性为 ECharts 的 CDN 地址
script.src = 'https://cdn.jsdelivr.net/npm/echarts@5.4.0/dist/echarts.min.js'
// 将 script 元素添加到页面的 head 或 body 中
document.head.appendChild(script)

// 这里加个onload事件,因为需要等上述操作完毕再执行下面的,下面的页面就是我们的公共的组件了
script.onload = function () {
  let str = `
  <!DOCTYPE html>
<html lang="en">

<head>
  <meta charset="UTF-8">
  <meta name="viewport" content="width=device-width, initial-scale=1.0">
  <title>Document</title>
  /** 这里写样式 **/
  <style>
    #chart {
      width: 600px;
      height: 400px;
    }
  </style>
</head>

<body>
  <!-- 用于展示图表的容器 -->
  <div id="chart"></div>
</body>
</html>
`
  // 这里写后续的js操作
  // 获取 id 为 chart 的 div 元素
  var chartDiv = document.getElementById('abc')
  console.log('chartDiv', chartDiv)
  // 将新创建的 HTML 内容作为 div 的 innerHTML 插入
  chartDiv.innerHTML = str

  // 模拟数据
  let datax = ['00:00', '00:01', '00:02', '00:03', '00:04', '00:05', '00:06', '00:07', '00:08', '00:09', '00:10', '00:11']
  let data = [112, 118, 123, 128, 134, 126, 119, 114, 182, 130, 132, 127]

  // 初始化 ECharts 实例
  var myChart = echarts.init(document.getElementById('chart'))
  console.log('myChart', myChart)
  // 指定图表的配置项和数据
  var option = {
    grid: {
      top: 40,
      bottom: 40,
      left: 60,
      right: 40,
      containLabel: true, // 如果需要包含轴标签,请设置为 true
    },
    tooltip: {
      trigger: 'axis',
      backgroundColor: "rgba(0,0,0,0.3)",
      textStyle: {
        color: "#FFFFFF", // 文字的颜色
      },
      borderColor: "transparent",
      borderWidth: 1,
      formatter: function (params) {
        return (
          params[0].marker +
          "心率: " + params[0].data +
          "<br/><span style='margin-left:0.25rem'></span>" +
          params[0].axisValue
        )
      },
    },
    xAxis: {
      type: 'category',
      data: datax,
      axisTick: {
        show: false  // 禁用 x 轴刻度线
      },
      axisLine: {
        show: true,  // 显示 x 轴线
        lineStyle: {
          color: '#CCCCCC'  // 设置 x 轴线颜色
        },
      },
      axisLabel: {
        color: '#666666'  // 设置 x 轴标签颜色
      },
      splitLine: {
        show: true,  // 显示 x 轴分隔线
        lineStyle: {
          type: 'dashed'  // 设置分隔线为虚线
        }
      },
    },
    yAxis: {
      type: 'value',
      min: 85,
      max: 185,
      interval: 20,
      axisTick: {
        show: false  // 禁用 y 轴刻度线
      },
      axisLabel: {
        color: '#666666',  // 设置 y 轴标签颜色
        formatter: function (value) {
          if (value == 85) return ''
          return value
        }
      },
      axisLine: {
        show: true,  // 显示 y 轴线
        lineStyle: {
          color: '#CCCCCC'  // 设置 y 轴线颜色
        },
      },
      splitLine: {
        show: true,  // 显示 y 轴分隔线
        lineStyle: {
          type: 'dashed'  // 设置分隔线为虚线
        }
      }
    },
    series: [{
      name: '心率',
      type: 'line',
      smooth: true,
      data: data,
      showSymbol: false  // 禁用数据点标记
    }]
  }

  // 使用刚指定的配置项和数据显示图表。
  myChart.setOption(option)
}
当我们有多个外部js要添加到head头上面是,需要等待全部load事件完毕后,再执行下面的相关代码,如下是示例代码
// 创建一个数组来存放所有需要加载的 JavaScript 文件的 URL
var scriptUrls = [
  'https://cdn.jsdelivr.net/npm/echarts@5.4.0/dist/echarts.min.js', // 使用echarts
  'https://cdnjs.cloudflare.com/ajax/libs/jquery/3.7.1/jquery.min.js' // 使用jquery
]

// 计数器,用于记录已加载的 script 数量
var loadedCount = 0

// 遍历数组,为每个 URL 创建一个 script 元素并加载
scriptUrls.forEach(function (url) {
  var script = document.createElement('script')
  script.src = url
  // 设置 script 元素的属性,确保在加载完成后执行回调函数
  script.onload = function () {
    loadedCount++
    // 当所有 script 元素都加载完成后执行的回调函数
    if (loadedCount === scriptUrls.length) {
      // 这里可以开始使用加载的外部 JavaScript 文件中的功能
      initializeApp()
    }
  }
  // 将 script 元素添加到页面的 head 或 body 中
  document.head.appendChild(script)
})

// 初始化函数,在所有 script 元素加载完成后调用
function initializeApp () {
  let str = `
  <!DOCTYPE html>
<html lang="en">

<head>
  <meta charset="UTF-8">
  <meta name="viewport" content="width=device-width, initial-scale=1.0">
  <title>Document</title>
  <style>
    #chart {
      width: 600px;
      height: 400px;
    }
  </style>
</head>

<body>
  <!-- 用于展示图表的容器 -->
  <div id="chart"></div>
</body>
</html>
`
  // 这里写后续的js操作
  // 获取 id 为 chart 的 div 元素
  // 这里使用了jquery
  var chartDiv = $('#abc').get(0)
  // 将新创建的 HTML 内容作为 div 的 innerHTML 插入
  chartDiv.innerHTML = str

  // 模拟数据
  let datax = ['00:00', '00:01', '00:02', '00:03', '00:04', '00:05', '00:06', '00:07', '00:08', '00:09', '00:10', '00:11']
  let data = [112, 118, 123, 128, 134, 126, 119, 114, 182, 130, 132, 127]

  // 初始化 ECharts 实例
  // 这里使用了jquery和echarts
  var myChart = echarts.init($('#chart').get(0))
  // 指定图表的配置项和数据
  var option = {
    grid: {
      top: 40,
      bottom: 40,
      left: 60,
      right: 40,
      containLabel: true, // 如果需要包含轴标签,请设置为 true
    },
    tooltip: {
      trigger: 'axis',
      backgroundColor: "rgba(0,0,0,0.3)",
      textStyle: {
        color: "#FFFFFF", // 文字的颜色
      },
      borderColor: "transparent",
      borderWidth: 1,
      formatter: function (params) {
        return (
          params[0].marker +
          "心率: " + params[0].data +
          "<br/><span style='margin-left:0.25rem'></span>" +
          params[0].axisValue
        )
      },
    },
    xAxis: {
      type: 'category',
      data: datax,
      axisTick: {
        show: false  // 禁用 x 轴刻度线
      },
      axisLine: {
        show: true,  // 显示 x 轴线
        lineStyle: {
          color: '#CCCCCC'  // 设置 x 轴线颜色
        },
      },
      axisLabel: {
        color: '#666666'  // 设置 x 轴标签颜色
      },
      splitLine: {
        show: true,  // 显示 x 轴分隔线
        lineStyle: {
          type: 'dashed'  // 设置分隔线为虚线
        }
      },
    },
    yAxis: {
      type: 'value',
      min: 85,
      max: 185,
      interval: 20,
      axisTick: {
        show: false  // 禁用 y 轴刻度线
      },
      axisLabel: {
        color: '#666666',  // 设置 y 轴标签颜色
        formatter: function (value) {
          if (value == 85) return ''
          return value
        }
      },
      axisLine: {
        show: true,  // 显示 y 轴线
        lineStyle: {
          color: '#CCCCCC'  // 设置 y 轴线颜色
        },
      },
      splitLine: {
        show: true,  // 显示 y 轴分隔线
        lineStyle: {
          type: 'dashed'  // 设置分隔线为虚线
        }
      }
    },
    series: [{
      name: '心率',
      type: 'line',
      smooth: true,
      data: data,
      showSymbol: false  // 禁用数据点标记
    }]
  }

  // 使用刚指定的配置项和数据显示图表。
  myChart.setOption(option)
}
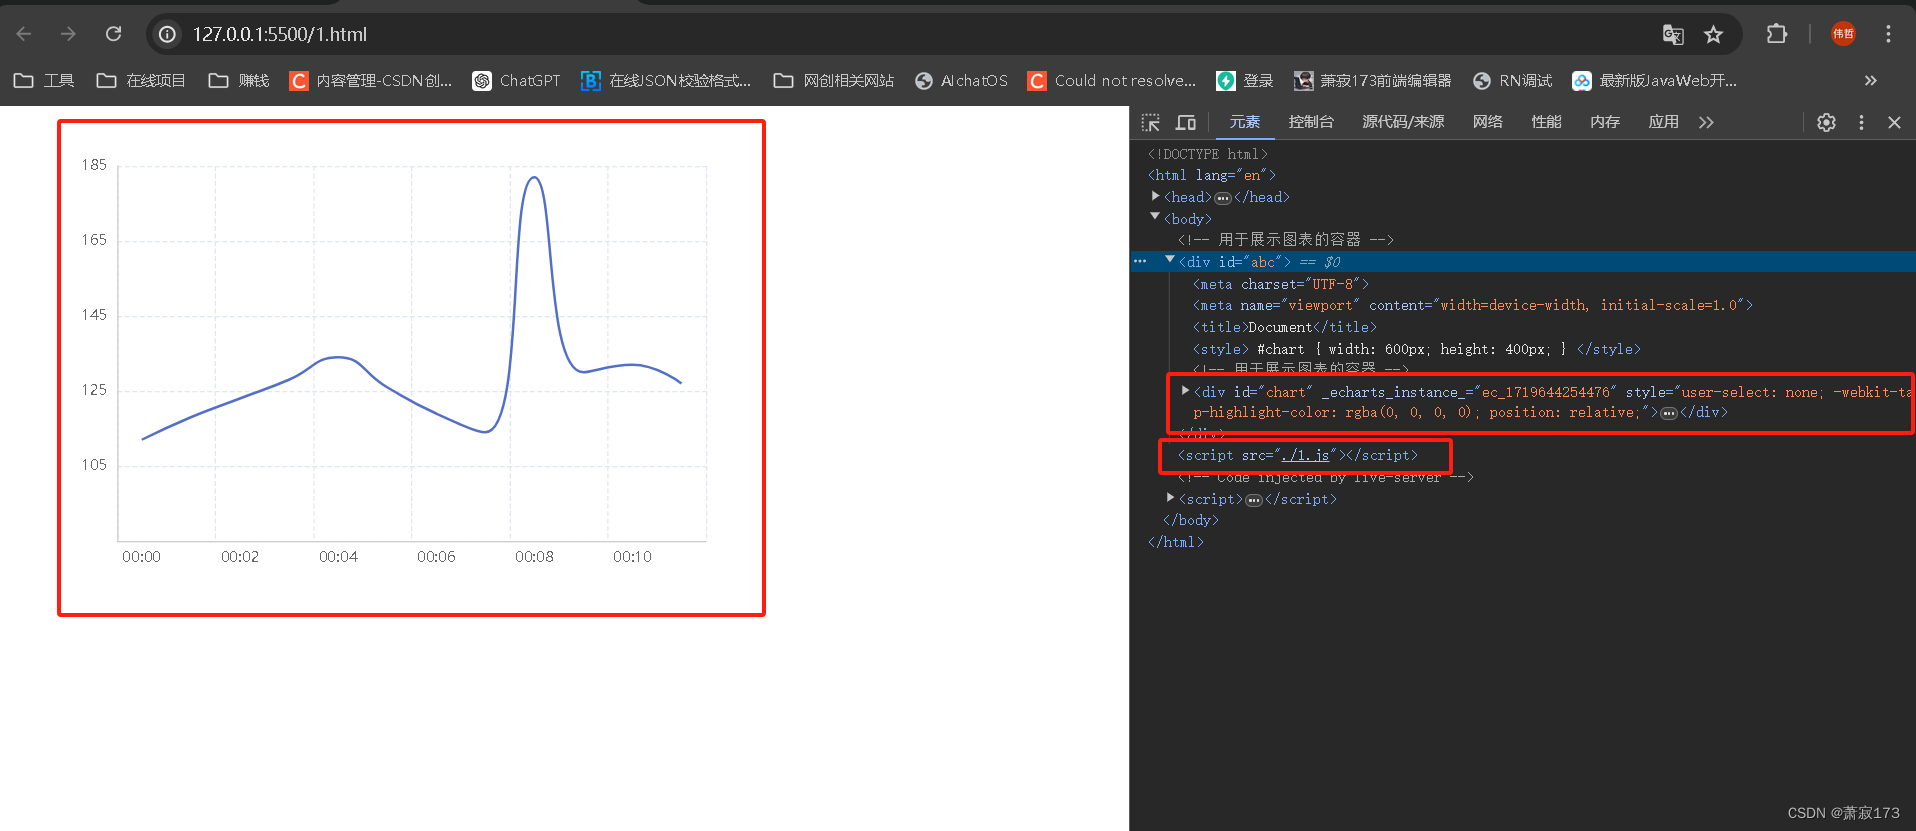
页面的使用方式
<!DOCTYPE html>
<html lang="en">

<head>
  <meta charset="UTF-8">
  <title>ECharts Line Chart Example</title>
</head>

<body>
  <!-- 用于展示组件的容器 -->
  <div id="abc"></div>
  <!-- 我们上面的js是在id为abc里面追加我们的echarts容器组件的 -->
  <script src="./1.js"></script>
</body>

</html>
效果图


 4200
4200

 被折叠的 条评论
为什么被折叠?
被折叠的 条评论
为什么被折叠?
 到【灌水乐园】发言


