


在vue3中如何使用echarts图表
下载插件
npm i echarts
在使用的组件中引入echarts
import * as echarts from "echarts";
定义存放图表的div定义好宽高
配置使用的图表样式
const state = reactive({
option: {
grid: {
top: '4%',
left: '2%',
right: '4%',
bottom: '0%',
containLabel: true,
},
xAxis: [
{
type: 'category',
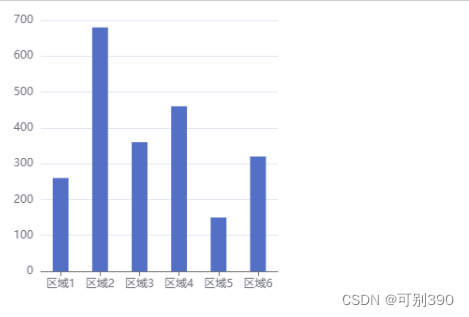
data: ["区域1","区域2","区域3","区域4","区域5","区域6"],
axisTick: {
alignWithLabel: true,
},
},
],
yAxis: [
{
type: 'value',
},
],
series: [
{
name: '学校',
type: 'bar',
barWidth: '40%',
data: [260,680,360,460,150,320],
},
],
},
})
将图标插入到div
  const initeCharts = () => {
        let myChart = echarts.init(document.getElementById('myChart'))
        // 绘制图表
        myChart.setOption(state.option)

      }
在页面挂载前调用
onMounted(()=>{
    initeCharts()
})
这样就在vue3中使用图表echarts就完成了
echarts官网链接: https://echarts.apache.org/examples/en/index.html


 1108
1108

 被折叠的 条评论
为什么被折叠?
被折叠的 条评论
为什么被折叠?
 到【灌水乐园】发言


