


从Keras库里调取数据,训练数据,验证数据,测试数据
import keras
fashion_mnist = keras.datasets.fashion_mnist
(x_train_all, y_train_all), (x_test, y_test) = fashion_mnist.load_data()
x_valid, x_train = x_train_all[:5000], x_train_all[5000:]
y_valid, y_train = y_train_all[:5000], y_train_all[5000:]

print(x_valid.shape, y_valid.shape)
print(x_train.shape, y_train.shape)
print(x_test.shape, y_test.shape)
输出结果:
(5000, 28, 28) (5000,)
(55000, 28, 28) (55000,)
(10000, 28, 28) (10000,)
调取一张图片
import matplotlib.pyplot as plt
def show_single_image(img_arr):
    plt.imshow(img_arr, cmap="binary")
    plt.show()

show_single_image(x_train[0])
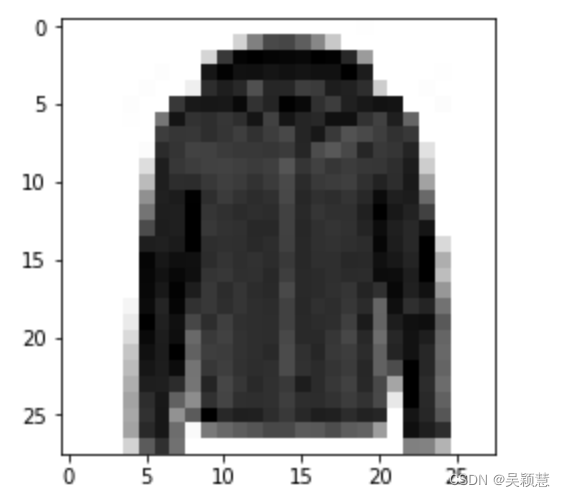
cmap——颜色图谱
def show_imgs(n_rows, n_cols, x_data, y_data, class_names):
    assert len(x_data) == len(y_data)
    assert n_rows * n_cols < len(x_data)
    plt.figure(figsize = (n_cols * 1.4, n_rows * 1.6))
    num = n_rows * n_cols
    for i in range(num):
        index = i + 1
        plt.subplot(n_rows,n_cols,index)
        plt.imshow(x_train[index-1],cmap="binary",interpolation="nearest")
        plt.axis("off")
        plt.title(class_names[y_train[index-1]])
    plt.show()
show_images(3,4,x_train,y_train,class_names)
assert 断言函数,验证,条件限制,不符合条件就停止跳出;
figsize 画布尺寸宽*高(几列乘以几行);
interpolation=“nearest” 如果显示分辨率与图像分辨率不同时,它将产生一个图像,其中像素显示为多个像素的正方形。

model = keras.models.Sequential()
model.add(keras.layers.Flatten(input_shape=[28,28]))
model.add(keras.layers.Dense(300,activation="relu"))
model.add(keras.layers.Dense(100,activation="relu"))
model.add(keras.layers.Dense(10,activation="sofemax"))
也可写成这样:
model = keras.models.Sequential([
    keras.layers.Flatten(input_shape=[28,28]),
    keras.layers.Dense(300,activation="relu"),
    keras.layers.Dense(100,activation="relu"),
    keras.layers.Dense(10,activation="softmax")
])
relu: y=max(0,x) , x>0, 取x, x<0,取0
sofemax 多分类输出,将向量变成概率分布,x = [x1,x2,x3]
y=[e^x1 /sum,e^x2 /sum,e^x3 /sum] sum = e^x1 +e^x2+ e^x3
y = [y1,y2,y3], y1+y2+y3=1 , 0<y1,y2,y3<1
model.compile(loss="sparse_categorical_crossentropy",
              optimizer = "sgd",
              metrics = ["accuracy"])
sparse_categorical_crossentropy ——交叉熵函数 y的输入为index(一个数值)
categorical_crossentropy —— y的输入为one—hot([0,0,1])
optimizer梯度下降(sgd随机梯度下降,bgd批量梯度下降,msgd小批量梯度下降)
metrics准确率计算方法
| accuracy | 真实值为int,预测值也为int:[0, 1, 3, 3, 4, 2] |
| categorical_accuracy | 真实值为onehot标签 ,预测值为向量值 |
| binary_accuracy | 1.二进制标签[0, 0, 0, 1, 1, 0]。 2.有threshold |
| sparse_categorical_accuracy | 真实值为int, 预测值为向量值 |
print(model.layers)
查看模型构建框架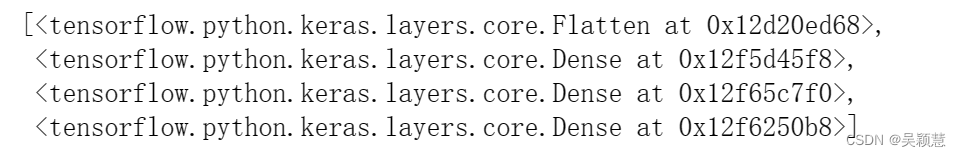
print(model.summary())

查看模型概况,都有多少参数进行训练 样本数[None,784]784维矩阵——经全连接变成300维矩阵
[None,784]w[784,300]+b[300]–[None,300] w权重,b偏执 784300+300=23550
history = model.fit(x_train, y_train, epochs=10,
                    validation_data=(x_valid, y_valid))

type(history)——查询类型
tensorflow.python.keras.callbacks.History
print(history.history)——查询loss,accuracy等数值变化
import pandas as pd
def plot_learning_curves(history):
    pd.DataFrame(history.history).plot(figsize=(8, 5))
    plt.grid(True)
    plt.gca().set_ylim(0, 1)
    plt.show()

plot_learning_curves(history)
grid(True) 显示网格线
plt.gca() 获取坐标轴信息
set_ylim(0, 1) 设置y轴限制,0-1区间

数据转化成one-hot结构
convert to 1-of-k encoding index变one-hot
num_classes = 10
y_train = keras.utils.to_categorical(y_train,num_classes)
y_test = keras.utils.to_categorical(y_test,num_classes)


 2132
2132


 被折叠的 条评论
为什么被折叠?
被折叠的 条评论
为什么被折叠?
 到【灌水乐园】发言


