


为更好地提供数据支持的电影制作依据,要求大家以TMDB 5000 Movie Dataset数据集为研究对象,使用Pycharts库完成以下数据可视化任务:2000-2016年期间Twentieth Century Fox Film Corporation、Universal Pictures和Paramount Pictures三家影视公司每年制作的电影数量。
import pandas as pd
from pyecharts.charts import Line          #导入pyecharts.charts
from pyecharts import options as opts     #导入pyecharts

import warnings
# 忽略警告。pandas很多时候会弹出警告,说某条命令即将在新版本中过期,建议换用新命令。如不想看到警告信息,可用此设置忽略
warnings.filterwarnings('ignore')
df = pd.read_excel('11周课后作业T2预处理后的数据.xlsx')
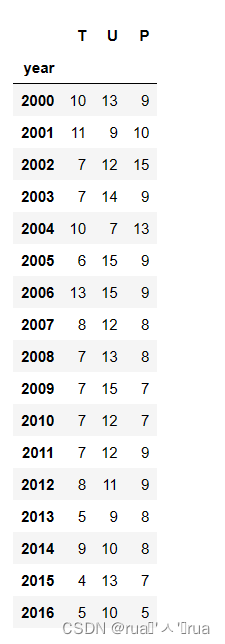
df#查看df数据

df.dropna(inplace=True)
#筛选出2000年到2016年的数据
df = df[(df['year'] >= 2000)&(df['year'] <= 2016)]
df.reset_index(inplace=True)
#df.info()
#3家要统计的公司
three_companies = ['Twentieth Century Fox Film Corporation',
'Universal Pictures','Paramount Pictures']
for company in three_companies:
df[company] = df['production_companies'].str.contains(company).apply(lambda x: 1 if x else 0)
#df.to_excel('data__1.xlsx')
company_year = df.loc[:,three_companies]
#将年份作为标签索引
company_year.index = df['year']
#将数据按年份分组求和,得出每个年份,各电影类型的电影总数
three_companies_df = company_year.groupby('year').sum()
three_companies_df.columns = ['T','U','P']
years = list(three_companies_df.index)
years = [str(i)for i in years]#查看three_companies_df内容
#用pyecharts画折线图
line = (
    Line(init_opts=opts.InitOpts(width="1200px",height="520px"))
    .add_xaxis(years)
    .add_yaxis("Twentieth Century Fox Film Corporation",three_companies_df['T'].tolist())
    .add_yaxis("Universal Pictures",three_companies_df['U'].tolist())
    .add_yaxis("Paramount Pictures",three_companies_df['P'].tolist())
    .set_global_opts(
        title_opts=opts.TitleOpts(title="2000-2016三公司每年制作电影数量对比图"),
        yaxis_opts=opts.AxisOpts(name="电影数量(部)",
                                name_location="center",
                                name_gap=30,
                                name_textstyle_opts=opts.TextStyleOpts(font_size=15)),
        xaxis_opts=opts.AxisOpts(name="年份",
                                name_location="center",
                                name_gap=40,
                                axislabel_opts={"rotate":30},
                                name_textstyle_opts=opts.TextStyleOpts(font_size=15)),
    )
    .render("2000-2016三公司每年制作电影数量对比图.html")
)
pyecharts折线图效果:


 444
444


 被折叠的 条评论
为什么被折叠?
被折叠的 条评论
为什么被折叠?
 到【灌水乐园】发言


