


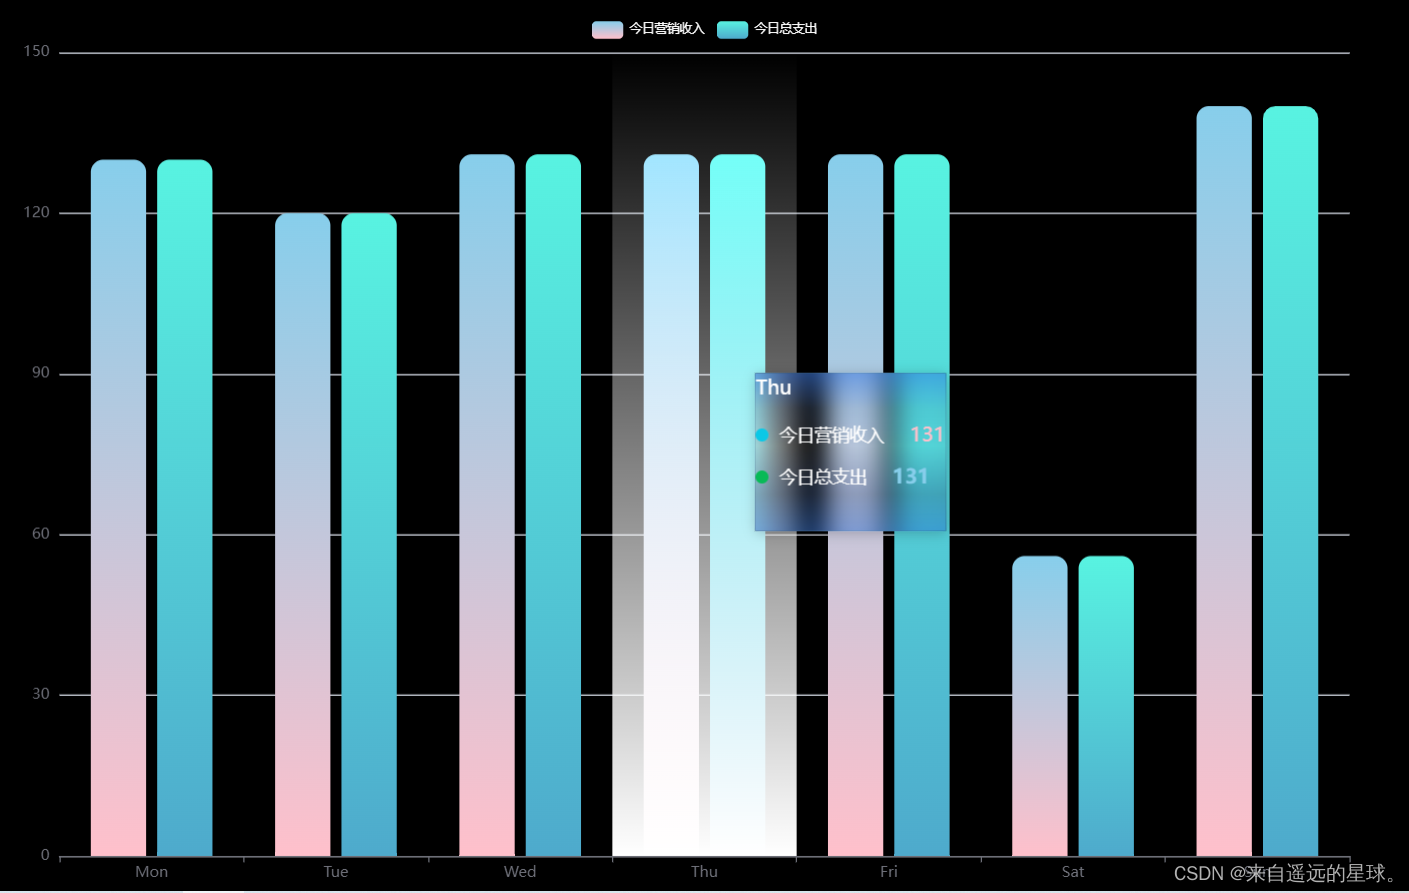
1.效果图
2.代码如下
<template>
  <div
    ref="main"
    id="main"
    style="height: 100%; width: 100%; background: black"
  ></div>
</template>

<script setup lang="ts">
// 引入hook
import { ref, reactive, onMounted } from 'vue'
// 引入 echarts
import * as echarts from 'echarts'
import type { utilsParams, funcFace1 } from '@/utils/interface'
const obj: utilsParams = {
  id: 11,
  name: 'yancy'
}

const func: funcFace1 = (str) => str
const user: utilsParams = reactive({
  id: 11,
  name: 'yancy'
})
console.log(user)
console.log(obj, func('str'))
// 定义一个ref
const main = ref<any>(null)
// const a = ref<string | number>(20)
// 定义初始化echarts函数
const initView = (): void => {
  const chinas = echarts.init(main.value)
  const option: utilsParams = {
    tooltip: {
      trigger: 'axis',
      padding: 0,
      backgroundColor: 'transparent',
      borderColor: 'none',
      borderWidth: 0,
      axisPoi
 最低0.47元/天 解锁文章


 7753
7753


 被折叠的 条评论
为什么被折叠?
被折叠的 条评论
为什么被折叠?
 到【灌水乐园】发言


