


CS224W: Machine Learning with Graphs
Stanford / Winter 2021
12-motifs
Subgraphs and Motifs
Subgraphs and Motifs
Definition: Subgraph
Definition: Subgraph
-
Node-induced subgraph
-
Take subset of the nodes and all edges induced by the nodes (由节点集和与这些节点相关的边所建立的子图)
-
G ′ = ( V ′ , E ′ ) G^{\prime}=\left(V^{\prime}, E^{\prime}\right) G′=(V′,E′) is a node induced subgraph iff
-
V ′ ⊆ V V^{\prime} \subseteq V V′⊆V
-
E ′ = { ( u , v ) ∈ E ∣ u , v ∈ V ′ } E^{\prime}=\left\{(u, v) \in E \mid u, v \in V^{\prime}\right\} E′={(u,v)∈E∣u,v∈V′}
-
G ′ G' G′ is the subgraph of G G G induced by V ′ V' V′
-
-
-
Edge-induced subgraph
-
Take subset of the edges and all corresponding nodes (由边集和这些边对应的节点所建立的子图)
-
G ′ = ( V ′ , E ′ ) G^{\prime}=\left(V^{\prime}, E^{\prime}\right) G′=(V′,E′) is an edge induced subgraph iff
-
E ′ ⊆ E E^{\prime} \subseteq E E′⊆E
-
V ′ = { v ∈ V ∣ ( v , u ) ∈ E ′ V^{\prime}=\left\{v \in V \mid(v, u) \in E^{\prime}\right. V′={v∈V∣(v,u)∈E′ for some u } \left.u\right\} u}
-
-
-
-
The best definition depends on the domain (哪种定义适用取决于具体的问题)
-
Chemistry: node-induced (functional groups)
-
Knowledge graphs: Often edge-induced (focus is on edges representing logical relations)
-
-
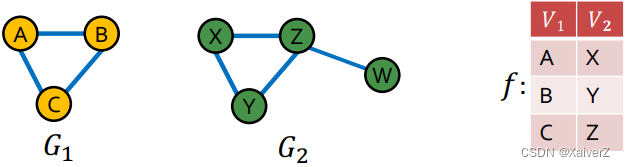
Graph Isomorphism: Check whether two graphs are identical
- G 1 = ( V 1 , E 1 ) G_{1}=\left(V_{1}, E_{1}\right) G1=(V1,E1) and G 2 = ( V 2 , E 2 ) G_{2}=\left(V_{2}, E_{2}\right) G2=(V2,E2) are isomorphic if there exists bijection f : V 1 → V 2 f: V_{1} \rightarrow V_{2} f:V1→V2 such that ( u , v ) ∈ E 1 (u,v) \in E_1 (u,v)∈E1 iff ( f ( a ) , f ( b ) ) ∈ E 2 (f(a), f(b)) \in E_{2} (f(a),f(b))∈E2 (若两张图存在一个双射函数,使一个图的所有节点能唯一映射到另一个图的节点,那么这两张图是同构的)

-
前述的定义中,无论是哪种方式,子图的节点和边都来自原图 G G G。如果子图的节点和边来自于一个完全不同的图呢?
-
G 2 G_2 G2 is subgraph-isomorphic to G 1 G_1 G1 if some subgraph of G 2 G_2 G2 is isomorphic to G 1 G_1 G1
-
也可以直接说 G 1 G_1 G1是 G 2 G_2 G2的一个子图
-
We can use either the node-induced or edge-induced definition of subgraph
-
-
-
Case Example of Subgraphs
Network Motifs
Network Motifs
-
Network Motifs: recurring, significant patterns of interconnections
-
Pattern: Small (node-induced) subgraph
-
Recurring: Found many times, i.e., with high frequency (How to define frequency?)
-
Significant: More frequent than expected, i.e., in randomly generated graphs (How to define random graphs?)
-
Subgraph Frequency
Subgraph Frequency
-
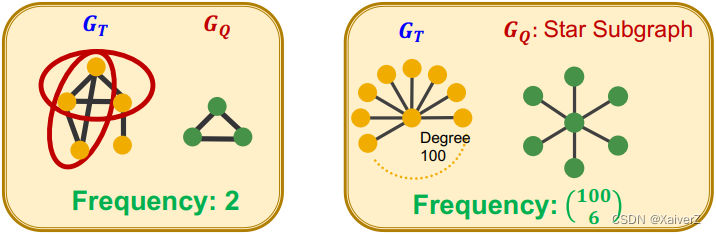
Graph-level Subgraph Frequency Definition
Let G Q G_Q GQ be a small graph and G T G_T GT be a target graph dataset
- Frequency of G Q G_Q GQ in G T G_T GT: number of unique subsets of nodes V T V_T VT of G T G_T GT for which the subgraph of G T G_T GT induced by the nodes V T V_T VT is isomorphic to G Q G_Q GQ
-
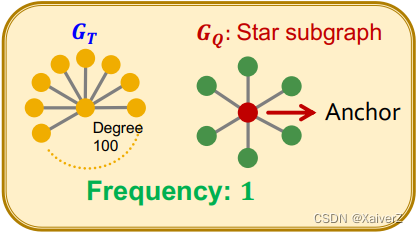
Node-level Subgraph Frequency Definition
Let G Q G_Q GQ be a small graph, v v v be a node in G Q G_Q GQ (the “anchor”) and G T G_T GT be a target graph dataset
-
The number of nodes u u u in G T G_T GT for which some subgraph of G T G_T GT is isomorphic to G Q G_Q GQ and the isomorphism maps u u u to v v v (不同子图的锚点不能重复)
-
Let ( G Q , v ) (G_Q,v) (GQ,v) be called a node-anchored subgraph
-
Motif Significance
Motif Significance
-
To define significance we need to have a null-model (i.e., point of comparison)
-
Key Idea: Subgraphs that occur in a real network much more often than in a random network have functional significance (若一个子图在真实网络中出现的频率比在多个随机生成的统计相似的图中出现的平均频率还要高,那么就说明这个子图具备一定的显著性)
-
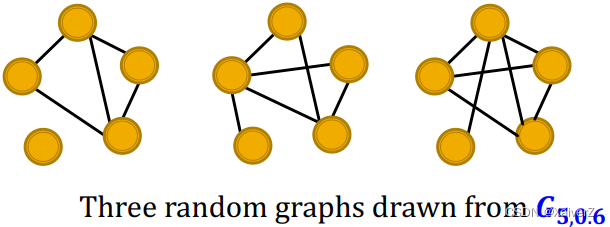
Erdős–Rényi (ER) random graphs
- G n , p G_{n,p} Gn,p: undirected graph on n n n nodes where each edge ( u , v ) (u,v) (u,v) appears i.i.d. with probability p p p (每两节点之间连边的概率为 p p p)
-
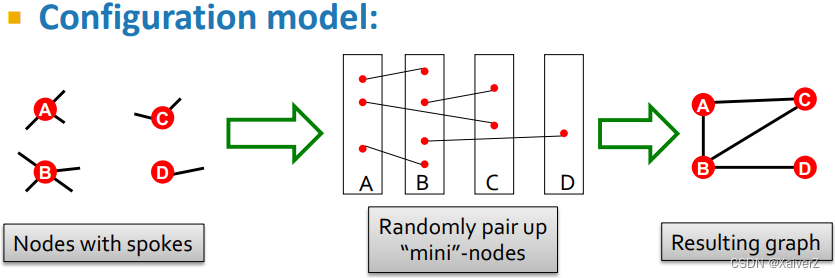
Configuration Model
-
Generate a random graph with a given degree sequence k 1 , k 2 , … k N k_{1}, k_{2}, \ldots k_{N} k1,k2,…kN (节点的度分布要保持一致)
-
Useful as a “null” model of networks
Null Model: Each G r a n d G^{rand} Grand has the same #(nodes), #(edges) and degree distribution as G r e a l G^{real} Greal
- We can compare the real network G r e a l G^{real} Greal and a random G r a n d G^{rand} Grand which has the same degree sequence as G r e a l G^{real} Greal
-
-
Intuition: Motifs are overrepresented in a network when compared to random graphs
-
Step 1: Count motifs in the given graph ( G r e a l G^{real} Greal) (在原图中统计motifs)
-
Step 2: Generate random graphs with similar statistics (e.g. number of nodes, edges, degree sequence), and count motifs in the random graphs (以与原图相似的统计信息构建多个随机生成图并分别统计motifs)
-
Step 3: Use statistical measures to evaluate how significant is each motif (使用一些统计评价标准衡量motifs significance)
- Use Z-score
-
-
Z-score for Statistical Significance
-
Z i Z_i Zi captures statistical significance of motif i i i
Z i = ( N i real − N ˉ i rand ) / std ( N i rand ) Z_{i}=\left(N_{i}^{\text {real }}-\bar{N}_{i}^{\text {rand }}\right) / \operatorname{std}\left(N_{i}^{\text {rand }}\right) Zi=(Nireal −Nˉirand )/std(Nirand )
其中, N i real N_{i}^{\text {real }} Nireal 为原图 G r e a l G^{real} Greal中第 i i i个motif的数量; N ˉ i rand \bar{N}_{i}^{\text {rand }} Nˉirand 为多个随机生成图中的第 i i i个motif的平均频数;std为多个随机生成图中的第 i i i个motif的标准差 -
Negative values indicate under-representation
-
Positive values indicate over-representation
-
-
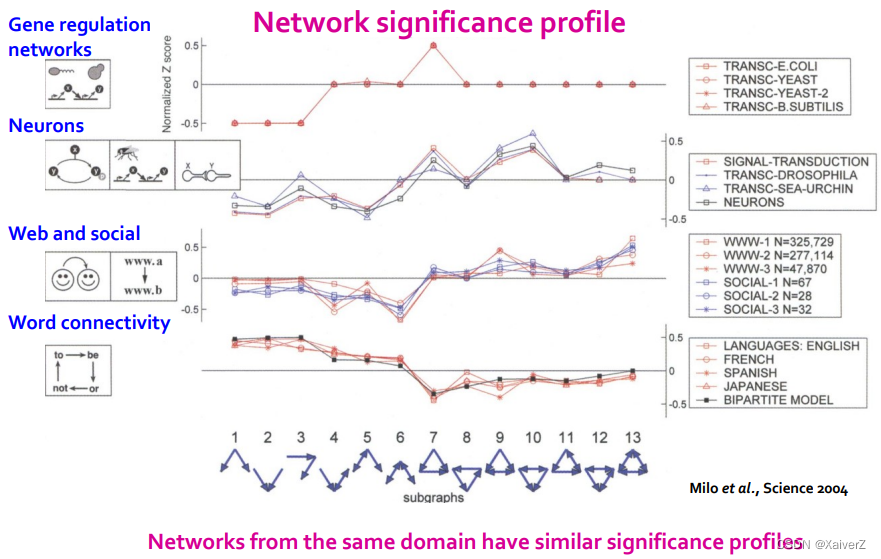
Network significance profile (SP)
S P i = Z i / ∑ j Z j 2 S P_{i}=Z_{i} / \sqrt{\sum_{j} Z_{j}^{2}} SPi=Zi/j∑Zj2
-
SP is a vector of normalized Z-scores
-
The dimension depends on number of motifs considered (维度取决于考虑多少个不同的motifs)
-
SP emphasizes relative significance of subgraphs (SP强调的是子图间的相对显著性程度)
-
-
Example
Neural Subgraph Matching
Neural Subgraph Matching
-
Task

- 由于寻找子图是NP-hard,故使用神经网络来进行子图匹配

-
Neural Architecture for Subgraphs
-
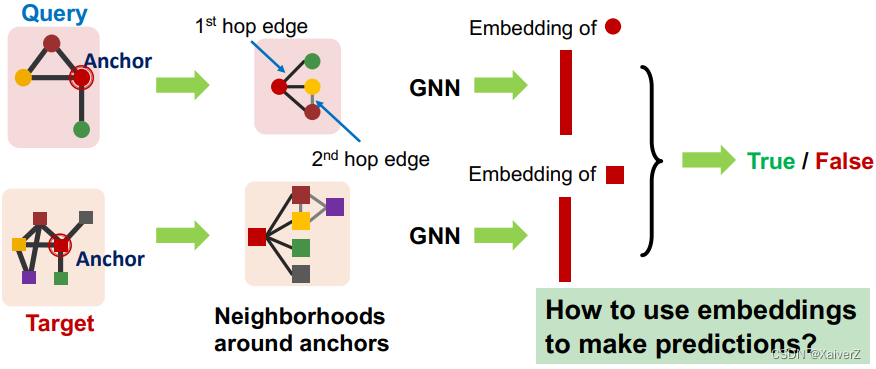
这里要使用node-anchored neighborhoods,使用GNN捕捉 u u u和 v v v (分别是Query和Target的锚点) 的representation,预测节点 u u u的邻居结构是否与节点 v v v的邻居结构同构
-
Why Anchor?
- We not only predict if there exists a mapping, but also a identify corresponding nodes ( u u u and v v v)
-
-
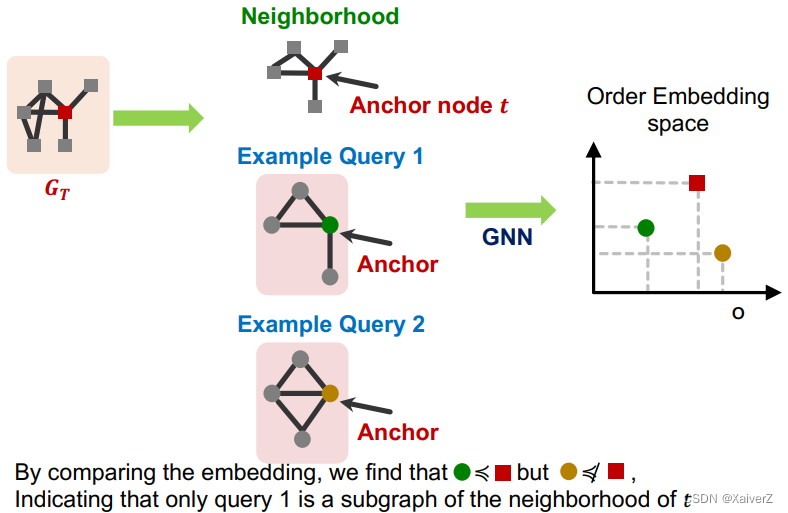
Decomposing G T G_T GT into Neighborhoods
-
For each node in G T G_T GT
-
Obtain a k-hop neighborhood around the anchor
-
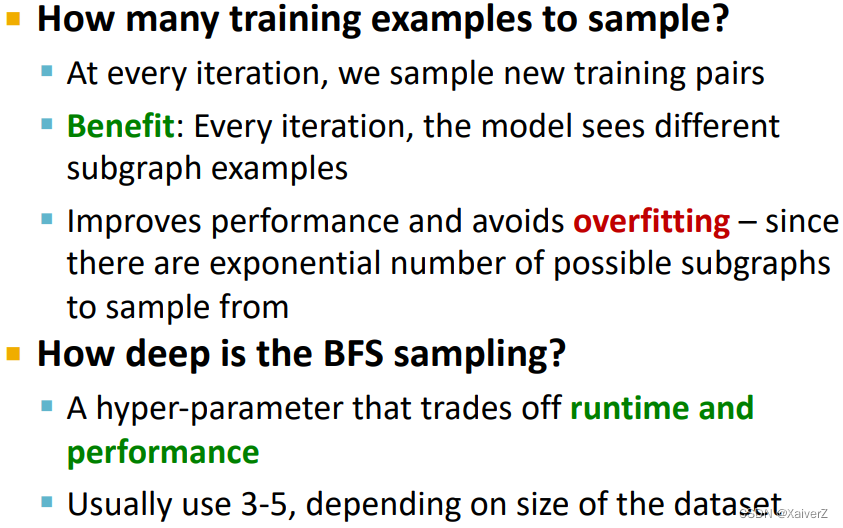
Can be performed using breadth-first search (BFS)
-
The depth k k k is a hyper-parameter (e.g. 3)
- Larger depth results in more expensive model
-
-
Same procedure applies to G Q G_Q GQ to obtain the neighborhoods
-
We embed the neighborhoods using a GNN (上述的步骤都可以用GNN来替代)
- By computing the embeddings for the anchor nodes in their respective neighborhoods (在锚点各自的邻居结构中计算embeddings,与GNN的Message Passing过程完全对应)
-
Order Embedding Space
Order Embedding Space
-
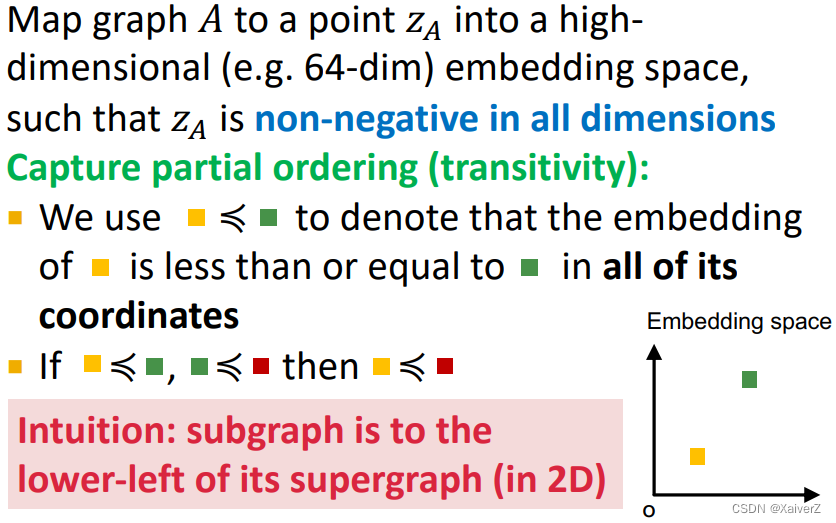
Capture Partial Ordering (偏序)
左下的embedding是右上的embedding的子图
-
Why Order Embedding Space?
Subgraph isomorphism relationship can be nicely encoded in order embedding space (下述属性都完美对应到了Order Embedding Space中)
-
Transitivity (传递性): G 1 G_1 G1是 G 2 G_2 G2的子图, G 2 G_2 G2是 G 3 G_3 G3的子图,那么 G 1 G_1 G1是 G 3 G_3 G3的子图
-
Anti-symmetry (反对称性): G 1 G_1 G1是 G 2 G_2 G2的子图, G 2 G_2 G2是 G 1 G_1 G1的子图,那么 G 1 G_1 G1与 G 2 G_2 G2同构
-
Closure under intersection: 仅含一个节点的图是所有图的子图

-
-
Loss Function: Order Constraint
-
max-margin loss
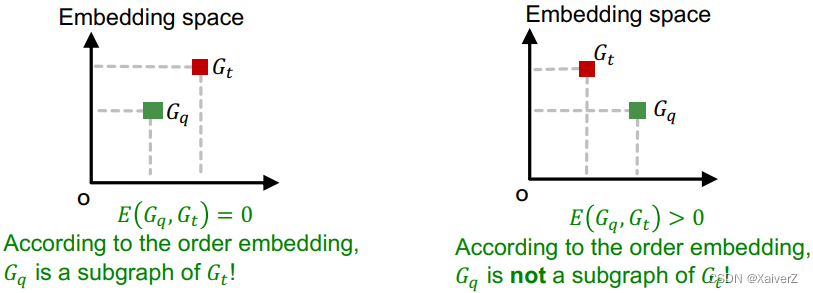
E ( G q , G t ) = ∑ i = 1 D ( max ( 0 , z q [ i ] − z t [ i ] ) ) 2 E\left(G_{q}, G_{t}\right)=\sum_{i=1}^{D}\left(\max \left(0, z_{q}[i]-z_{t}[i]\right)\right)^{2} E(Gq,Gt)=i=1∑D(max(0,zq[i]−zt[i]))2
-
-
Training Neural Subgraph Matching
-
To learn such embeddings, construct training examples ( G q , G t ) (G_q, G_t) (Gq,Gt) where half the time, G q G_q Gq is a subgraph of G t G_t Gt, and the other half, it is not
-
Train on these examples by minimizing the following max-margin loss
-
For positive examples: Minimize E ( G q , G t ) E(G_q, G_t) E(Gq,Gt) when G q G_q Gq is a subgraph of G t G_t Gt
-
For negative examples: Minimize max ( 0 , α − E ( G q , G t ) ) \max \left(0, \alpha-E\left(G_{q}, G_{t}\right)\right) max(0,α−E(Gq,Gt))
- Max-margin loss prevents the model from learning the degenerate strategy of moving embeddings further and further apart forever
-
-
-
Training Example Construction

-
Training Details
-
Subgraph Predictions on New Graphs

Mining Frequent Motifs
Mining Frequent Motifs
-
Finding Frequent Subgraphs (找出给定size-k下,在目标图中出现频率最大的子图,这里的子图匹配使用node-anchored subgraph)
-
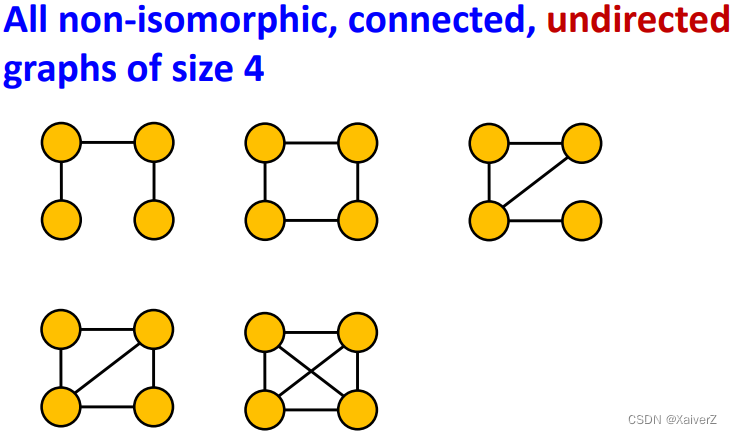
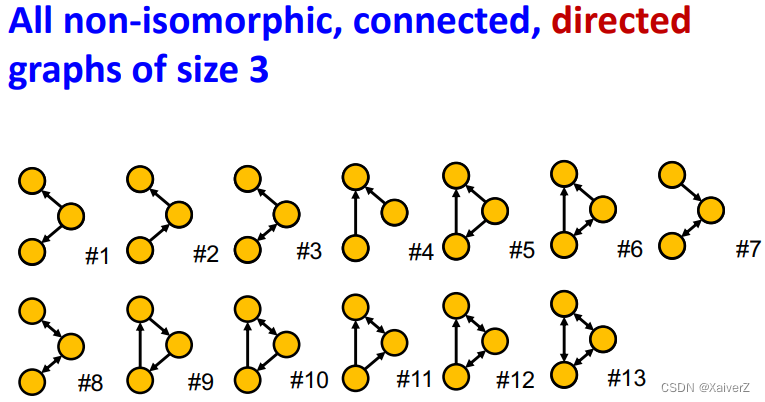
Enumerating all size-k connected subgraphs
-
Counting #(occurrences of each subgraph type)
-
-
Why is it Hard?
-
给定size-k下的可能子图组合形式就已经需要很大计算量了
-
判断子图从属关系是NP-hard,所以计数计算量也很大
-
SPMiner
SPMiner
-
Overview: a neural model to identify frequent motifs

-
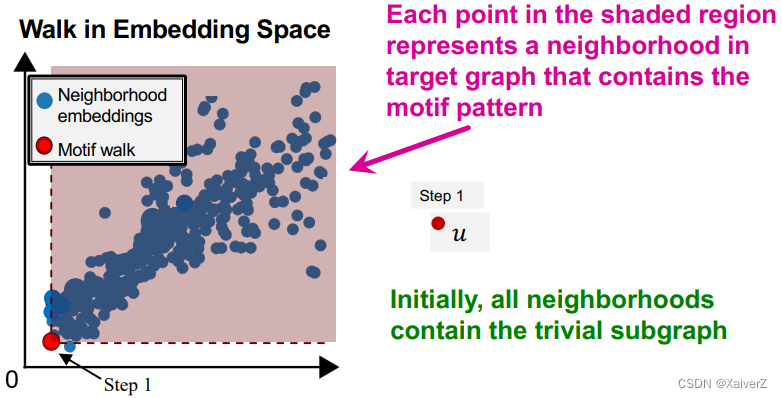
Key Idea: order embedding之后,可以很方便的计算出以某个节点为锚点,k-hop (size-k)的子图在目标图中出现的频数,只需要计算该节点在embedding space中,有多少节点的embedding在vector space中位于它的右上区域

-
SPMiner Search Procedure
SPMiner采用一种搜索策略,从size-1的子图开始搜索,直到达到要求的size-k,并保证搜索到达size-k时,能找到size-k各子图频数的最大值
-
Initial step: 在目标图中随机选取一个节点 u u u,令 S = u S={u} S=u
-
Iteratively: 通过不断迭代每次选取一个集合 S S S中节点的邻居,并加入到 S S S中,以此逐渐扩大motif的规模

-
我们希望迭代时能不断找到频数最大的motifs
-
Total violation of a subgraph G G G: the number of neighborhoods that do not contain G G G
-
The number of neighborhoods G N i G_{N_{i}} GNi that do not satisfy Z Q ⩽ Z N i Z_{Q} \leqslant Z_{N_{i}} ZQ⩽ZNi
-
Minimizing total violation = maximizing frequency
-
-
基于上述定义,我们可以直接使用启发式贪心策略:在每一步迭代中,添加能使total violation最小的邻居节点
-
-
Termination: 直到达到指定的motif size-k,红色阴影区域的点数量即为size-k motif的最大频数

-


 244
244


 被折叠的 条评论
为什么被折叠?
被折叠的 条评论
为什么被折叠?
 到【灌水乐园】发言


