


数据下载
ERA5-Land monthly averaged data from 1950 to present,下载地址:Copernicus Climate Data Store | Copernicus Climate Data Store
ERA5-Land hourly data from 1950 to present,下载地址:
ERA5-Land hourly data from 1950 to present (copernicus.eu)
可以选择下载的类别:
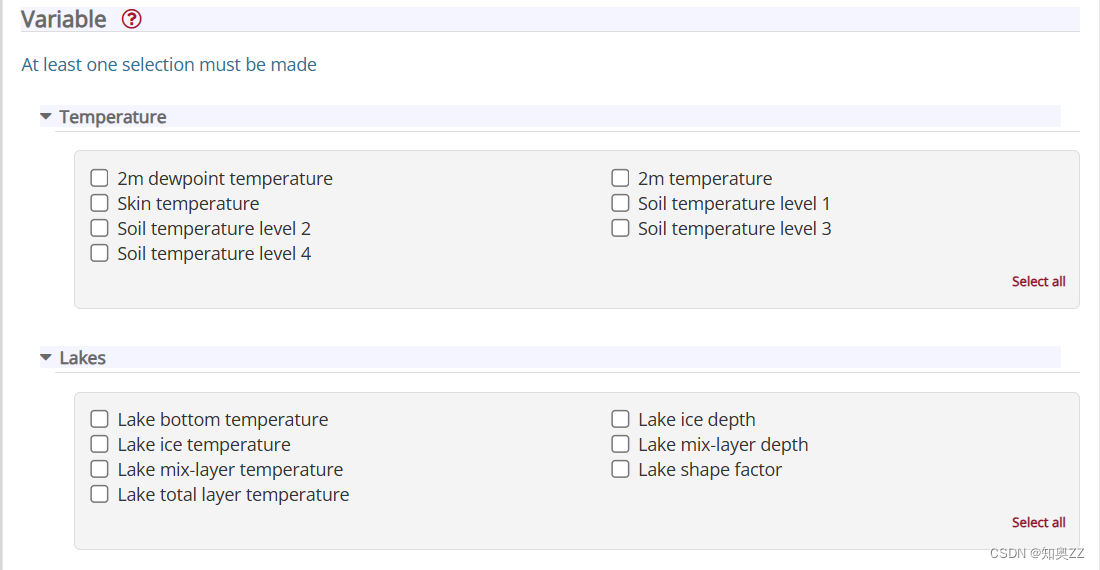
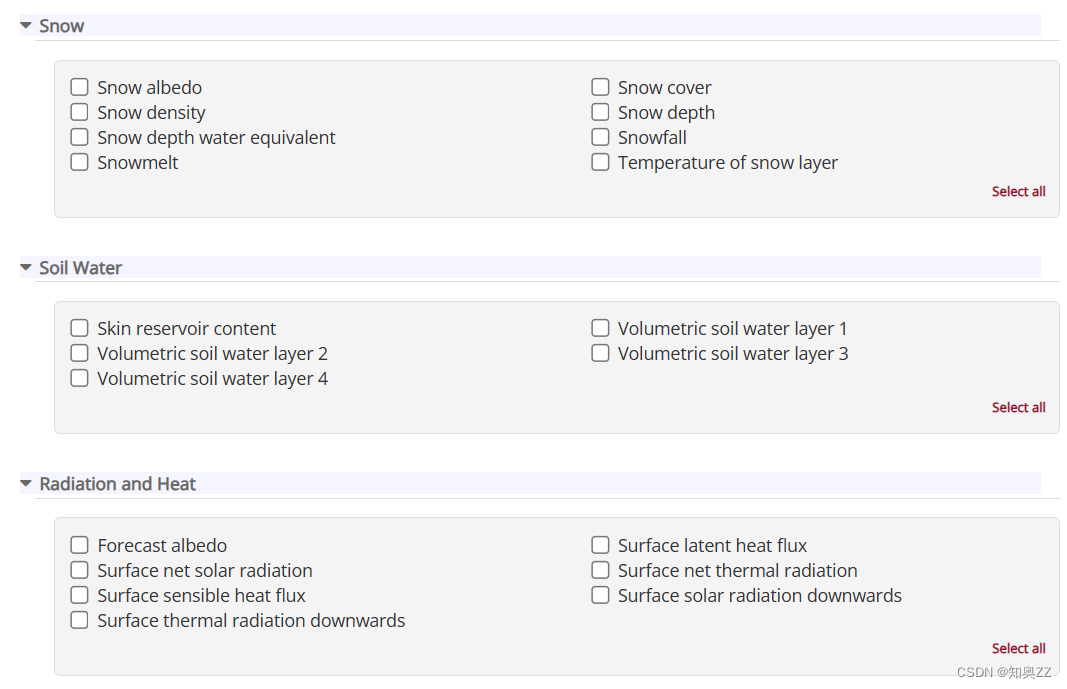
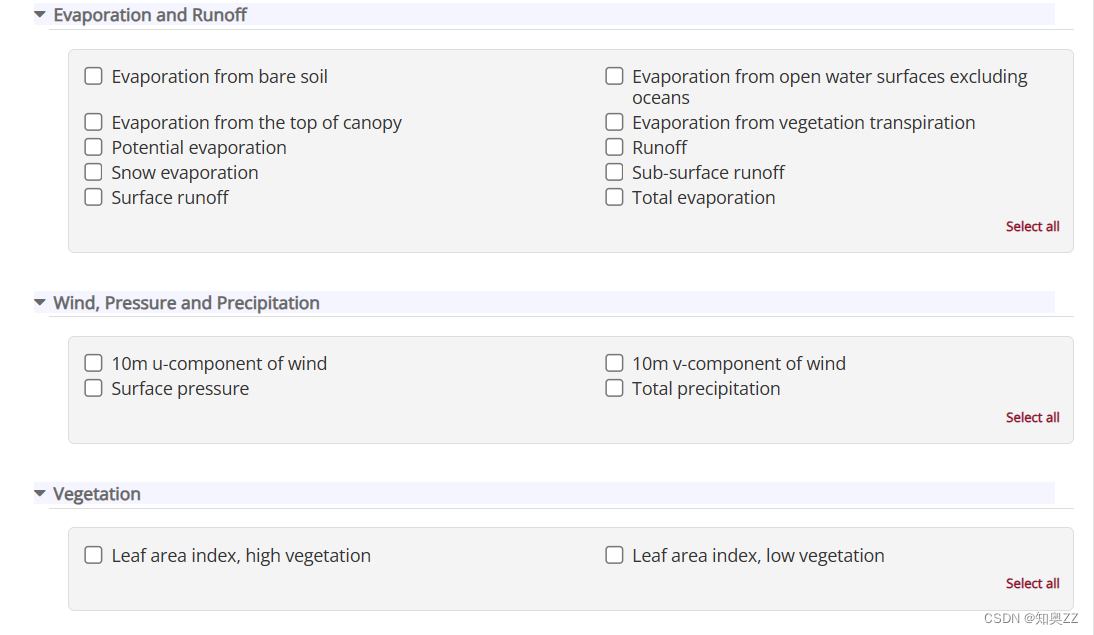
一般用上面这两个数据集即可,而还会有含有更多大气信息的数据集:ERA5 hourly data on single levels from 1940 to present (copernicus.eu)
比如降水类型里包含了多种分类。
选择需要类别、年份和时间,下载NetCDF格式文件,选得越多排队等待的时间就越长。
数据计算
需要安装一些包,需要提前下载轮子后再pip,轮子可从PyPI · The Python Package Index搜索下载。
代码计算:
import xarray as xr
from osgeo import gdal
import rasterio
from rasterio.transform import from_origin
import matplotlib.pyplot as plt
读取并打印下载的文件,查看需要计算的类别名称
data = xr.open_dataset(r'E:/data.nc')
print(data)
如这个数据的打印结果是:
<xarray.Dataset>
Dimensions:    (latitude: 511, longitude: 621, time: 744)
Coordinates:
  * longitude  (longitude) float32 73.0 73.1 73.2 73.3 ... 134.8 134.9 135.0
  * latitude   (latitude) float32 54.0 53.9 53.8 53.7 53.6 ... 3.3 3.2 3.1 3.0
  * time       (time) datetime64[ns] 2024-01-01 ... 2024-01-31T23:00:00
Data variables:
    tp         (time, latitude, longitude) float32 ...
Attributes:
    Conventions:  CF-1.6
    history:      2024-02-26 13:15:15 GMT by grib_to_netcdf-2.24.0: /opt/ecmw...
然后选择需要的变量
# 选择特定的变量
temperature = data['tp']
# 选择特定的时间范围
temperature_data_subset = temperature.sel(time=slice('2024-01-08T00:00:00', '2024-01-08T23:00:00'))
计算
global_mean_temperature = (temperature_data_subset.sum(dim=('time'))/30)*1000
print(global_mean_temperature)
制图
global_mean_temperature = global_mean_temperature.assign_coords(longitude=(global_mean_temperature.longitude + 180) % 360 - 180)
#global_mean_temperature = global_mean_temperature.clip(latitude=(-90, 90))
global_mean_temperature = global_mean_temperature.sortby('longitude')
latitude = global_mean_temperature['latitude'].values
longitude = global_mean_temperature['longitude'].values
出图
latitude = global_mean_temperature['latitude'].values
longitude = global_mean_temperature['longitude'].values
output_file = r"F:\CN_sumprec_9423_Jan.tif"
height, width = global_mean_temperature.shape
with rasterio.open(output_file, 'w', driver='GTiff', height=height, width=width, count=1,
                   dtype=str(global_mean_temperature.dtype),
                   crs='EPSG:4326',
                   transform=from_origin(longitude[0], latitude[0], abs(longitude[1] - longitude[0]),
                                        abs(latitude[1] - latitude[0]))) as dst:
    dst.write(global_mean_temperature, 1)

print("tif栅格文件已生成!")


 6074
6074

 被折叠的 条评论
为什么被折叠?
被折叠的 条评论
为什么被折叠?
 到【灌水乐园】发言


