% 灰色关联分析(GRA)示例代码
% 示例数据:参考序列与比较序列
% 行表示时间点或样本,列表示变量或特征
% 参考序列通常是我们要比较的目标
reference_sequence = [0.5, 0.6, 0.8, 0.9, 1.0]';
comparison_sequences = [
0.4, 0.55, 0.7, 0.85, 0.95;
0.6, 0.65, 0.75, 0.85, 1.05;
0.5, 0.6, 0.7, 0.8, 0.9
]';
% 步骤1:数据归一化处理
% 归一化公式:x = (x - min(x)) / (max(x) - min(x))
normalized_reference = (reference_sequence - min(reference_sequence)) / (max(reference_sequence) - min(reference_sequence));
normalized_comparisons = (comparison_sequences - min(comparison_sequences)) ./ (max(comparison_sequences) - min(comparison_sequences));
% 步骤2:计算灰色关联系数
% 灰色关联系数公式:ξ = (min(Δ) + ρ * max(Δ)) / (Δ + ρ * max(Δ))
% 其中,Δ是绝对差值,ρ是分辨系数,通常取值为0.5
rho = 0.5; % 分辨系数
abs_diff = abs(normalized_reference - normalized_comparisons); % 计算绝对差值
min_diff = min(abs_diff(:)); % 所有差值的最小值
max_diff = max(abs_diff(:)); % 所有差值的最大值
grey_relational_coefficients = (min_diff + rho * max_diff) ./ (abs_diff + rho * max_diff);
% 步骤3:计算灰色关联度
% 灰色关联度是对关联系数的平均值
grey_relational_grades = mean(grey_relational_coefficients);
% 输出灰色关联度结果
fprintf('灰色关联度:\n');
for i = 1:length(grey_relational_grades)
fprintf('序列 %d 的灰色关联度: %.4f\n', i, grey_relational_grades(i));
end
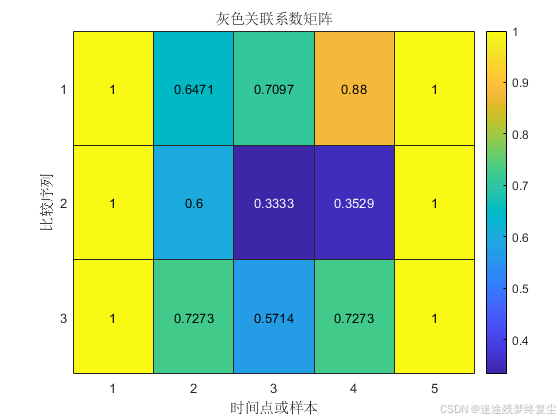
% 可视化灰色关联系数矩阵
figure;
heatmap(grey_relational_coefficients', 'Colormap', parula, 'ColorbarVisible', 'on');
title('灰色关联系数矩阵');
xlabel('时间点或样本');
ylabel('比较序列');
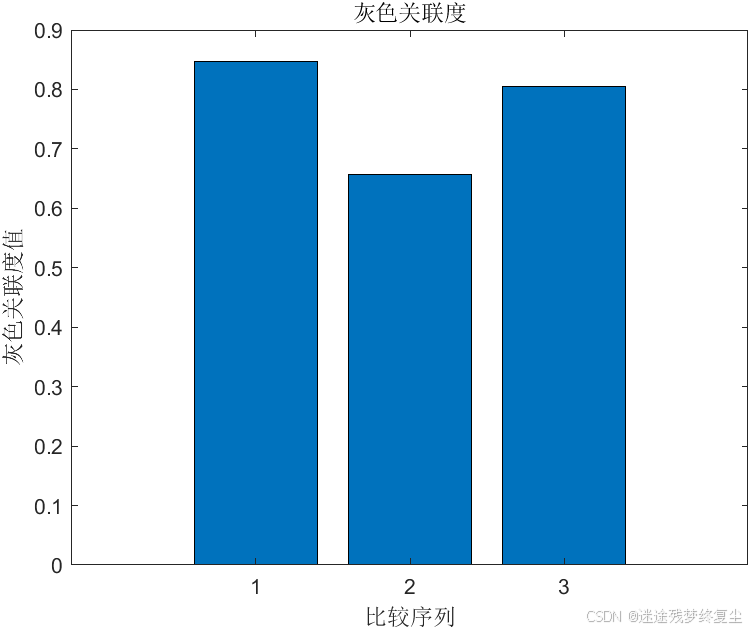
% 可视化灰色关联度
figure;
bar(grey_relational_grades);
title('灰色关联度');
xlabel('比较序列');
ylabel('灰色关联度值');


 2万+
2万+

 被折叠的 条评论
为什么被折叠?
被折叠的 条评论
为什么被折叠?
 到【灌水乐园】发言


